

Australian Dollar to Japanese Yen 1-hour pullback buying signal [RCI 3-line + mBDSR] 20181227
※Campaign is ongoing until January 10, 2019.
BODSOR (mBDSR)sales page ishere.
※ BODSOR and mBDSR are indicators developed to improve entry precision when making pullback buys or pullback sells using the RC I3-line.
The figure below is the CAD/JPY hourly chart.
AUD/JPY 1-hour chart (December 20–27, 2018)
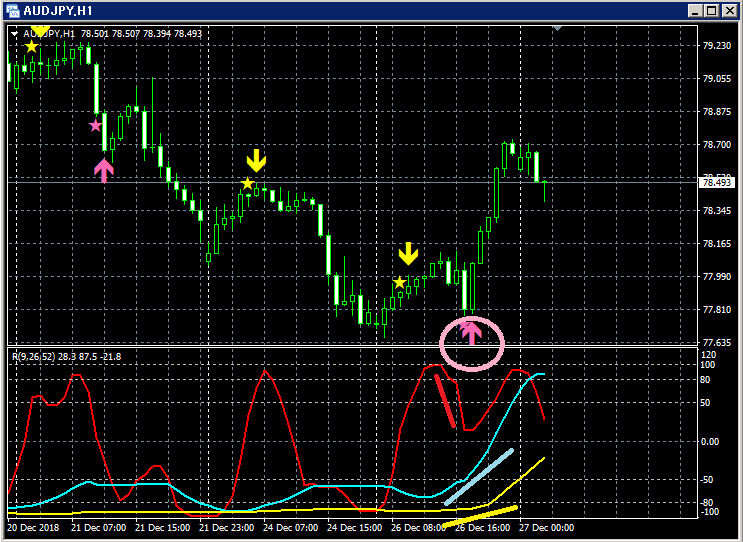
Top: mBDSR
If RCI9 reverses upward, all three RCI lines may rise together.
That is, there is a possibility of a strong price rise.
In such a situation,mBDSR pullback buy signal (pink arrows circled) lights up.
Right after the signal lights, five bullish candles occur in succession, and prices continue to rise smoothly afterward.
This can be seen in the chart.
In this example, the reversal of the declining RCI9 is confirmed after two bullish candles have formed following the signal.
and.
BODSOR (mBDSR) sales page ishere.

https://twitter.com/RCIX3Line
Blog
http://bodsor.blog.fc2.com/
Investment Navi+
https://fx-on.com/navi/serial/?id=359
YouTube
https://www.youtube.com/channel/UCL-g5uAlesiWVJEDtWlFvGw
Example of pullback buying and pullback selling signals on the USD/JPY 1-hour chart
※In the charts within this article, for convenience of explanation, there may be added circles, lines, or rectangles depicting currencies, etc., so please understand.


