

【Mastering RCI to Capture Trend Reversals!!】 Signals of Two-Bar Reversal and mBDSR, and Signals of R1 R2 S2 on the dollar/yen as of yesterday 2025/05/23
================================
(From Investment Navi + Free Articles)
【Important】Aim Big!! From Monthly to 5-Minute Chart
(Signals of RCI and Candlestick Patterns and mBDSR)
https://www.gogojungle.co.jp/finance/navi/articles/90626
================================
【Master RCI!! Trend Reversal, Buy Dips, Sell Rallies】
Indicator that shines in combination with RCI: BODSOR・mBDSR
Methods and Case Studies (PDF) ★GogoJungle AWARD 2020 Winner★
https://www.gogojungle.co.jp/tools/indicators/11836
R1R2S2is included in the above product. For details, please read the Investment Navi + article below.
RCI 3-lines 'Two-Stage Confirmation' to Target Trend Reversal, Buy Dips, and Sell Rallies – R1R2S2 Release!!
Below we show example wheremBDSR (Moving Average Filter)andR1R2S2
Dollar/Yen USDJPY 15-minute Chart, May 23, 2025
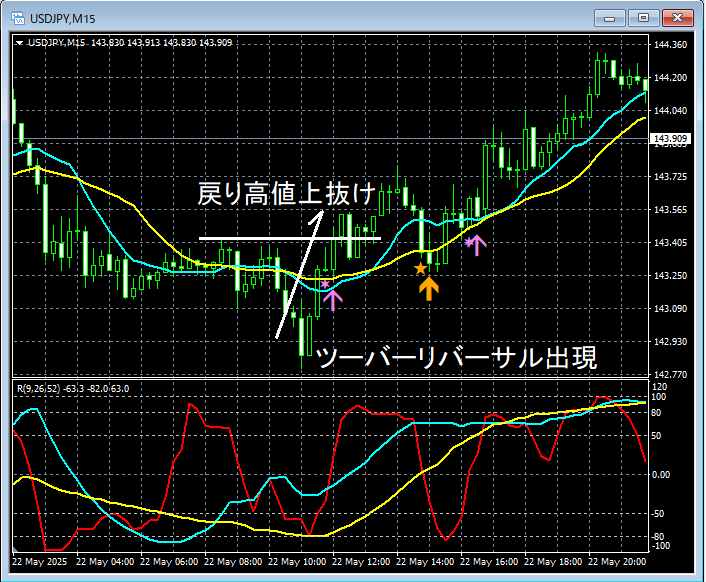
mBDSR (Moving Average Filter)andR1R2S2signals
On the 15-minute chart above, a signal suggesting an uptrend reversalTwo-Barrier Reversalappeared,
R1R2S2 Buy-the-Dip Signal
→ (Break above the high of the retracement)
→mBDSR Buy-the-Dip Signal
→R1R2S2 Buy-the-Dip Signal
signals light up in this order.
As in this example, when theR1R2S2 signallights up first, or when waiting for themBDSR (Two-Filter RCI) signalto appear,mBDSR (Two-Filter RCI) signalmay not light up, or if missed or delayed,the signals from theMoving Average Filter (mBDSR) andR1R2S2 signalscan be used as alternatives.
From this,R1R2S2andmBDSR (Two-Filter RCI) signalsandmBDSR (Moving Average Filter) Buy-the-Dip Signalsare often used in combination.
Indicator that shines in combination with RCI: BODSOR・mBDSR
Methods and Case Studies (PDF) ★GogoJungle AWARD 2020 Winner★
https://www.gogojungle.co.jp/tools/indicators/11836
PDF files are attached with 358 documents (over 1,400 pages, over 470,000 words in total).
Many of them are composed as follows:Using the RCI 3-line to logically link higher and lower timeframes, sequentially considering the situations of multiple lower timeframes, and ultimately waiting for the timing of a dip buy or rally sell on the lower timeframe (i.e., the signal of mBDSR).
Additionally,many emphasize identifying points where multiple entry reasons coincide..
Also included is a method to explore upside and downside targets using the RCI 3-line.
In the PDF descriptions,more than 1,350 chartsare used.

× ![]()


