

Use both the sign of mBDSR (RCI2 bandpass filter) and the sign of R1R2S2 (6) USD/JPY
===============================================
【Free Indicator Information】
An MT4 indicator that displays three RCI lines not in a sub-window,in the main windowon the MT4 chart.
【Free】 Indicator that displays three RCIs in MT4's main window
https://www.gogojungle.co.jp/tools/indicators/62950
===============================================
【Mastering RCI!! Trend Reversal, Buy on Dips, Sell on Rallies】
An indicator that shines when used with RCI in combination with the tools 【BODSOR・mBDSR】
and methods & case studies (PDF) ★GogoJungle AWARD 2020 winner★
https://www.gogojungle.co.jp/tools/indicators/11836
R1R2S2is included in the above product. For details, please read the following Investing Navi+ article.
RCI 3-line “Two-stage Confirmation” Indicator to Target Trend Reversals, Buy on Dips, and Sell on Rallies “R1R2S2” Released!!
Below, we introduce examples wheremBDSR (RCI two-line filter)andR1R2S2signals are displayed simultaneously.
USD/JPY 1-minute chart
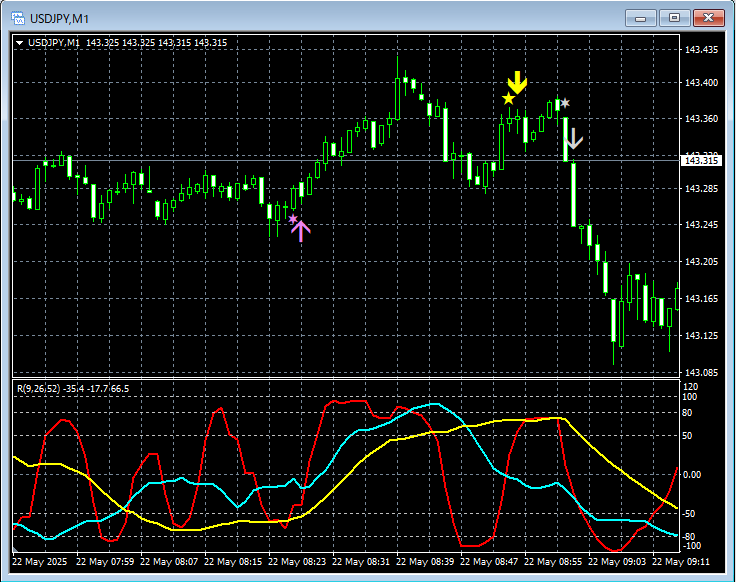
mBDSR (RCI two-line filter)andR1R2S2signals
On the 1-minute chart above,R1R2S2 Buy-the-dip signal→mBDSR (RCI two-line filter) Sell-on-rally signal→R1R2S2 Sell-on-rally signallights up in that order.
In this way,the signal from the mBDSR (RCI two-line filter)may not light up in a situation where you are waiting for it, or if you miss the signal or are late to respond,R1R2S2 signalscan sometimes be used to respond.
From this,R1R2S2isoften used in conjunction withmBDSR.
Indiator that shines when combined with RCI【BODSOR・mBDSR】
and methods & case studies (PDF) ★GogoJungle AWARD 2020 winner★
https://www.gogojungle.co.jp/tools/indicators/11836
The PDF file includes 358 items (over 1,400 pages, over 470,000 characters).
Most of them arecases where multiple timeframes are logically linked by using the RCI 3-line, and eventually the lower timeframe waits for a dip or rally timing (i.e., the signal from mBDSR)..
Also,many focus on capturing points where multiple entry criteria converge..
In addition,there is also a method to explore upside and downside targets using the RCI 3-line..
In the PDF explanations,over 1,350 chartsare used.

× ![]()


