

Master RCI with Moving Average Filter to Win!! Return Sell Signal for AUD/JPY by mBDSR
================================
(From Investment Navi+ Free Articles)
Chart Analysis Example (USD/JPY)
(Signals of RCI with candlestick patterns, moving averages, chart patterns, mBDSR and R1R2S2)
https://www.gogojungle.co.jp/finance/navi/articles/90838
================================
【Mastering RCI!! Trend Reversal, Buy on Dips, Sell on Rises】
Powerful combination with RCI: Indicator【BODSOR・mBDSR】
and Method / Case Studies (PDF) ★GogoJungle AWARD2020 Winner★
https://www.gogojungle.co.jp/tools/indicators/11836
The PDF file (methods & case studies) includes 358 items (over 1,400 pages, over 470,000 Japanese characters).
【Special Video Vol.01 / Blacksun】
【Free E-book】 Offers from overseas hedge funds!? A career history of trading by Japan’s leading RCI researcher
https://www.gogojungle.co.jp/finance/navi/articles/89634
【Special Video Vol.02 / Blacksun】
【The Definitive Guide | Mastery of RCI Analysis】A thorough explanation of multi-time-frame and technical methods to improve win rate
https://www.gogojungle.co.jp/finance/navi/articles/89635
【Special Video Vol.03 / Blacksun】
【Reason Why 400+ Users Joined】Improve trading edge with multi-timeframe analysis in MT5!
https://www.gogojungle.co.jp/finance/navi/articles/89636
mBDSR (RCI Filter)andmBDSR (Moving Average Filter)have different roles. The accompanying PDF covers how to use them appropriately.
Below,mBDSR (Moving Average Filter)sign examples are introduced.
AUD/JPY 5-minute chart May 20, 2025
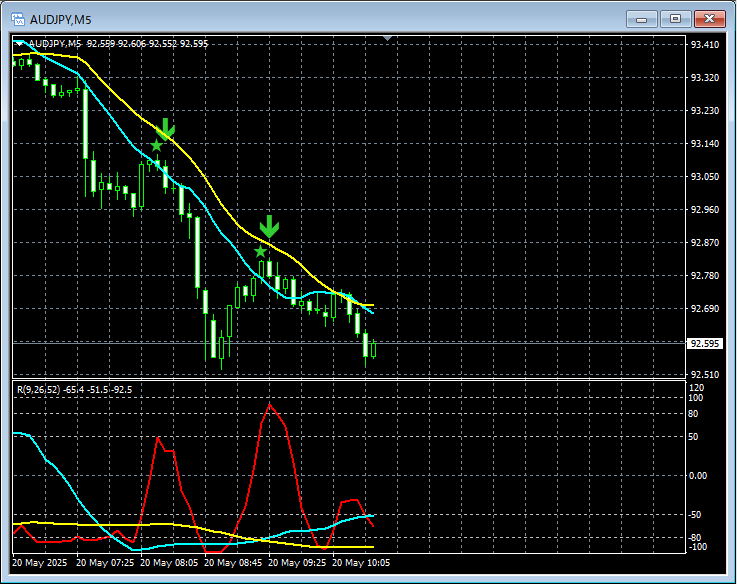
In the above 5-minute chart,the re-entry sell signal for mBDSR (Moving Average Filter)lights up in a timely manner.
mBDSR with Moving Average FilteralsoWhen used in conjunction with the three-line RCI on higher time frames to lower time framesit enables high-probability trades. The accompanying PDF also explains this.
*Note: In the charts introduced in this article, for ease of explanation, circles, lines, and squares may be added.
Powerful combination with RCI: Indicator【BODSOR・mBDSR】
and Method / Case Studies (PDF) ★GogoJungle AWARD2020 Winner★
https://www.gogojungle.co.jp/tools/indicators/11836
The PDF file includes 358 items (over 1,400 pages, over 470,000 Japanese characters).
Many of these areexamples that link higher-time-frame and lower-time-frame logically using the three-line RCI, sequentially examining the status of multiple lower-time frames, and ultimately waiting for a dip buy or a pullback sell signal on the lower time frame (i.e., the mBDSR signal)..
Additionally,many focus on identifying points where multiple entry reasons align..
Also included is a method for exploring rising and falling targets using the three-line RCI.
In the PDF explanations,over 1,350 chartsare used.

× ![]()


