

[mBDSR (RCI2 Full-Filt er) Win!!] Check near the moving average lines that you deem important for any signs of a reversal (8)
=================
(From Investment Navi+ Free Articles)
Recent USD/JPY trends
(RCI and candlestick patterns, moving averages, chart patterns, mBDSR and R1R2S2 signals)
https://www.gogojungle.co.jp/finance/navi/articles/90838
=================
Special Video Vol.01 / Blacksun
Free e-book: Offers from overseas hedge funds?! A top-tier RCI researcher's trading journey
https://www.gogojungle.co.jp/finance/navi/articles/89634
Special Video Vol.02 / Blacksun
The Essentials of RCI Analysis: Thorough explanations of multi-timeframe and technical methods to improve win rate
https://www.gogojungle.co.jp/finance/navi/articles/89635
Special Video Vol.03 / Blacksun
Reason for surpassing 400 users: Increase trading edge with MT5 multi-timeframe analysis
https://www.gogojungle.co.jp/finance/navi/articles/89636
USDJPY – USD/JPY 1-minute chart
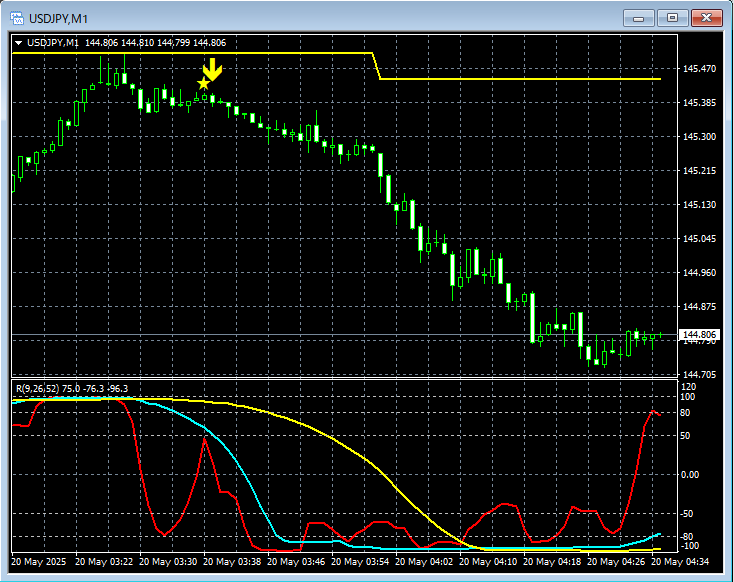
Looking at the 1-minute chart above, in this casethe nearby 4-hour EMA21is showing a tendency to bounce. Then,the price lights up sell signals from mBDSR (two RCI lines filter)and declines.
From this example,a trading method focused on pullbacks around moving averagesandthe signals of mBDSRare shown to be highly compatible.
Note: Some charts shown in this article may include annotations such as circles, lines, or rectangles for explanation purposes.
Indicators that pair powerfully with RCI: BODSOR and mBDSR
and techniques + case studies (PDF) ★GogoJungle AWARD2020 winner★
https://www.gogojungle.co.jp/tools/indicators/11836
The PDF file includes 358 files (over 1,400 pages, over 470,000 characters).
Many of them aresummaries of cases where using three RCI lines logically links higher and lower timeframes, examining multiple lower-timeframe conditions step by step, ultimately waiting for pullbacks or retracements on the lower timeframe signals (mBDSR)..
Additionally,many focus on identifying points where multiple entry reasons coincide..
Furthermore,there are methods that explore upward and downward targets using three RCI lines..
In the PDF explanations,more than 1,350 chartsare used.
× ![]()


