

[Master RCI by using a moving average filter to win!!] mBDSR’s counter-trend sell signal USD/JPY
=================
(Investment Navi + Free Articles)
Recent USDJPY Trend
(Signals from RCI, candlestick patterns, moving averages, chart patterns, mBDSR, and R1R2S2)
https://www.gogojungle.co.jp/finance/navi/articles/90838
=================
【Mastering RCI!! Trend Reversals, Buy on Dips, Sell on Rallies】
Indicator that shines in combination with RCI【BODSOR・mBDSR】
Methods & Case Studies (PDF) ★GogoJungle AWARD2020 Winner★
https://www.gogojungle.co.jp/tools/indicators/11836
The PDF includes 358 files of methods and case studies (over 1,400 pages, over 470,000 characters in total).
【Special Video vol.01 / Blacksun】
【Free e-book】Offers from overseas hedge funds!? A Trading Career of Japan’s Leading RCI Researchers
https://www.gogojungle.co.jp/finance/navi/articles/89634
【Special Video vol.02 / Blacksun】
【Definitive Guide | Secrets of RCI Analysis】Thorough explanation of multi-timeframe & technical methods to improve win rate
https://www.gogojungle.co.jp/finance/navi/articles/89635
【Special Video vol.03 / Blacksun】
【Reason for Over 400 Users: Elevate trading edge with MT5 multi-timeframe analysis】
https://www.gogojungle.co.jp/finance/navi/articles/89636
mBDSR (RCI Filter)andmBDSR (Moving Average Filter)have different roles. The accompanying PDF also covers how to use these distinctions.
Below,mBDSR (Moving Average Filter)sign examples will be 소개한다.
USDJPY 5-minute chart, May 9, 2025
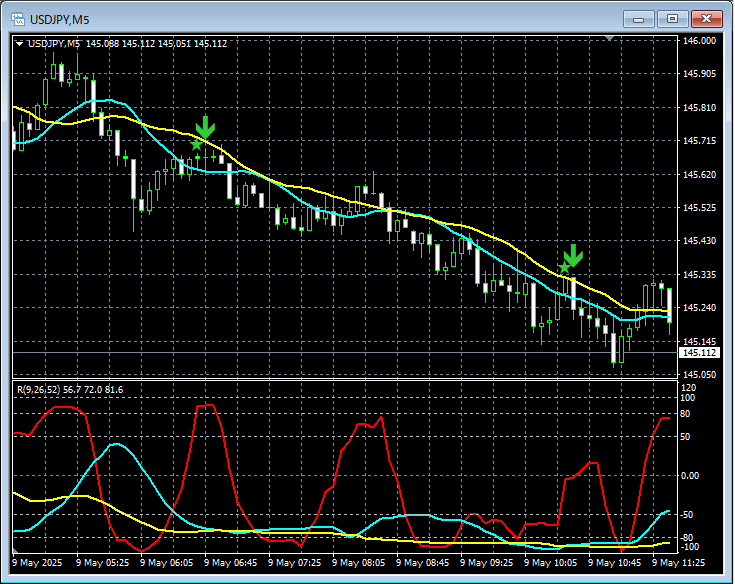
On the 5-minute chart above,mBDSR (Moving Average Filter)sell-on-rebound signal lights up at the right timing.
Moving Average Filter mBDSRalsoworks in tandem with using the three RCI lines to drill down from higher to lower timeframesto enable high-probability trades. This is also explained in the attached PDF.
※ Please note that the charts shown in this article may include circles, lines, and rectangles for ease of explanation.
Indicator that shines in combination with RCI【BODSOR・mBDSR】
and methods & case studies (PDF) ★GogoJungle AWARD2020 Winner★
https://www.gogojungle.co.jp/tools/indicators/11836
The PDF includes 358 files (over 1,400 pages, over 470,000 characters).
Many of themdocument how to logically link higher and lower timeframes using the three RCI lines, sequentially analyzing multiple lower-timeframe conditions, and ultimately waiting for dip-buying or countdown-selling signals on the lower timeframe (i.e., mBDSR signals).as examples.
Also,many emphasize capturing points where multiple entry reasons overlap.Also common.
Additionally,the method for exploring upside/downside targets using three RCI linesis included.
In the PDF explanations,over 1,350 chartsare used.

× ![]()


