

[Master RCI and Win with Moving Average Filter!!] mBDSR Buy-the-dip signal NZDUSD
===============================
(From Investment Navi+ Free Articles)
【Important】Aim High!! From Monthly to 5-Minute Chart
(RCI and Candlestick Patterns and mBDSR Signals)
https://www.gogojungle.co.jp/finance/navi/articles/90626
===============================
【Master RCI to Win!! Trend Reversal, Buy on Dips, Sell on Rallies】
Indicator that shines in combination with RCI:【BODSOR・mBDSR】
and its methods & case studies (PDF) ★GogoJungle AWARD2020 Award★
https://www.gogojungle.co.jp/tools/indicators/11836
The PDF file includes 358 manuals (over 1,400 pages, over 470,000 characters in total).
【Special Video vol.01 / Blacksun】
【Free eBook】 Offers from overseas hedge funds!? A trader’s journey of one of Japan’s leading RCI researchers
https://www.gogojungle.co.jp/finance/navi/articles/89634
【Special Video vol.02 / Blacksun】
【Definitive Guide|The Secrets of RCI Analysis】Thorough explanation of multi-timeframe and technical methods to increase win rate
https://www.gogojungle.co.jp/finance/navi/articles/89635
【Special Video vol.03 / Blacksun】
【Reason for 400+ Users】Elevate trading edge with MT5 multi-timeframe analysis!
https://www.gogojungle.co.jp/finance/navi/articles/89636
mBDSR (RCI Filter)andmBDSR (Moving Average Filter)have different roles. The accompanying PDF also discusses how to use these appropriately.
Below, we introduce examples of signals formBDSR (Moving Average Filter)signals.
NZDUSD 5-Minute Chart May 16, 2025
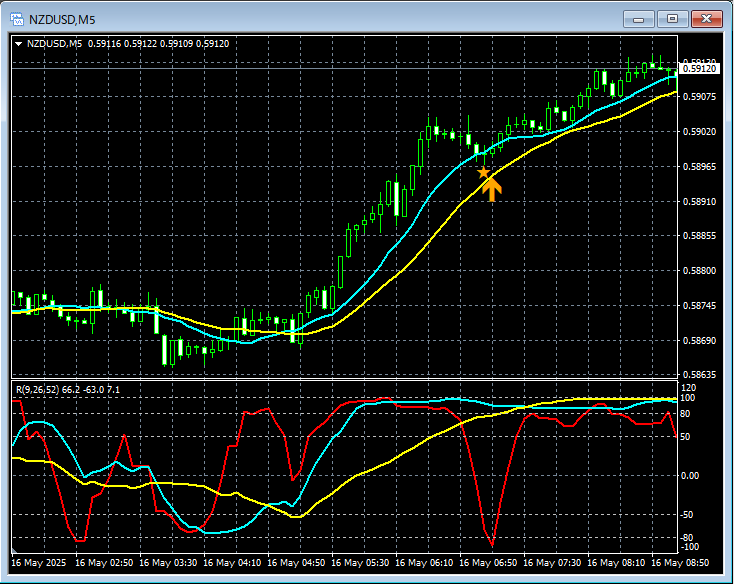
On the above 5-minute chart,mBDSR (Moving Average Filter)buy-on-dip signals light up precisely at the right time.
Moving Average Filter mBDSRalsowhen combined with the higher-to-lower time frame alignment using three RCI linesenables high-probability trades. This is also explained in the accompanying PDF.
※ Please note that in charts introduced in this article, for readability, circles, lines, and rectangles may be added.
The combination with RCI yields powerful indicators【BODSOR・mBDSR】
and methods & case studies (PDF) ★GogoJungle AWARD2020★
https://www.gogojungle.co.jp/tools/indicators/11836
The PDF file includes 358 items (over 1,400 pages, over 470,000 characters).
Many of them areexamples that logically link higher and lower timeframes using the three RCI lines, sequentially analyzing multiple lower timeframes, and ultimately waiting for a dip-buy or rally-sell timing (i.e., the mBDSR signals) on the lower timeframe.
Also,many are focused on identifying points where multiple entry reasons coincide..
Additionally,there are methods for exploring upside and downside targets using the three RCI lines..
In the PDF explanations,over 1,350 chartsare used.

× ![]()


