

【Master RCI to Win with Moving Average Filter!! Today's EUR/USD 20250519】Buy signal for pullback by mBDSR
=================
【RCI Related】Blacksun's Free Indicator and Free E-Books
https://www.gogojungle.co.jp/finance/navi/articles/90181
=================
【Master RCI!! Trend Reversal・Buy on Dip・Sell on Rallies】
Indicators that pair with RCI for power【BODSOR・mBDSR】
and Techniques・Case Studies (PDF) ★GogoJungle AWARD 2020 Recipient★
https://www.gogojungle.co.jp/tools/indicators/11836
PDF file (methods & case studies) includes 358 items (over 1,400 pages, over 470,000 characters).
【Special Video Vol.01 / Blacksun】
【Free E-book】 Offers from overseas hedge funds also!? A leading domestic RCI researcher's trading journey
https://www.gogojungle.co.jp/finance/navi/articles/89634
【Special Video Vol.02 / Blacksun】
【Definitive Guide|The Secrets of RCI Analysis】 Thorough explanation of multi-timeframe & technical methods to improve win rate
https://www.gogojungle.co.jp/finance/navi/articles/89635
【Special Video Vol.03 / Blacksun】
【Reason Why 400+ Users Chose It】Raise trading edge with MT5 version multi-timeframe analysis
https://www.gogojungle.co.jp/finance/navi/articles/89636
mBDSR (RCI Filter)andmBDSR (Moving Average Filter)have different roles. The differences in usage are also covered in the attached PDF.
Below,mBDSR (Moving Average Filter)signal examples are introduced.
EURUSD 5-minute chart on May 19, 2025
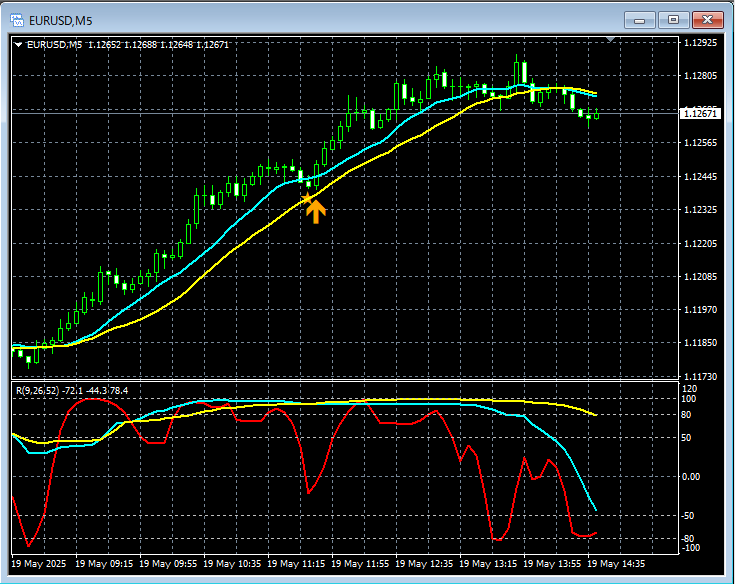
In the above 5-minute chart,mBDSR (Moving Average Filter)buy-the-dip signals light up at timely moments.
Moving Average Filter mBDSRalsoworks well when used in conjunction with RCI's three-line layout to map from higher to lower timeframesand can enable high-probability trades. This is explained in the attached PDF as well.
※ Please note that the charts in this article may have added circles, straight lines, or rectangles for explanatory convenience.
Indicators that pair with RCI for power【BODSOR・mBDSR】
and Techniques・Case Studies (PDF) ★GogoJungle AWARD 2020 Recipient★
https://www.gogojungle.co.jp/tools/indicators/11836
PDF file includes 358 items (over 1,400 pages, over 470,000 characters).
Most of them are compiled as examples that logically link higher and lower timeframes using the three-line RCI method, sequentially examining multiple lower-timeframe conditions, and ultimately waiting for dip buys or rallies on the lower timeframes (i.e., signals from mBDSR).
Additionally,many items emphasize identifying points where multiple entry reasons overlap.There are also many examples included.
Furthermore,the method for exploring upside targets and downside targets using the three-line RCIis included as well.
In the PDF explanations,over 1,350 chartsare used.

× ![]()


