

[Master RCI to Win!!] Look for signs of rebound around the moving average that we consider important (4)
=================
(Investment Navi + Free Articles)
【Important】Aim Big!! From Monthly to 5-Minute Chart
(Signals of RCI, Candlestick patterns, and mBDSR)
https://www.gogojungle.co.jp/finance/navi/articles/90626
=================
【Master RCI to Win!! Trend Reversal, Pullback Buying, and Rebound Selling】
Indicator that shines in combination with RCI【BODSOR・mBDSR】
and techniques・case studies (PDF) ★GogoJungle AWARD2020 Winner★
https://www.gogojungle.co.jp/tools/indicators/11836
The PDF file (techniques・case studies) includes 358 items (over 1,400 pages, over 470,000 characters).
【Special Video Vol.01 / Blacksun】
【Free eBook】 Offers from overseas hedge funds?! One of the top RCI researchers' trading history in Japan
https://www.gogojungle.co.jp/finance/navi/articles/89634
【Special Video Vol.02 / Blacksun】
【The Definitive Guide| Secrets of RCI Analysis】Comprehensive explanation of multi-timeframe and technical methods to improve win rate
https://www.gogojungle.co.jp/finance/navi/articles/89635
【Special Video Vol.03 / Blacksun】
【Reason for 400+ users】Raise trading advantage with MT5 version multi-timeframe analysis!
https://www.gogojungle.co.jp/finance/navi/articles/89636
AUD/JPY, AUDJPY, 5-minute chart
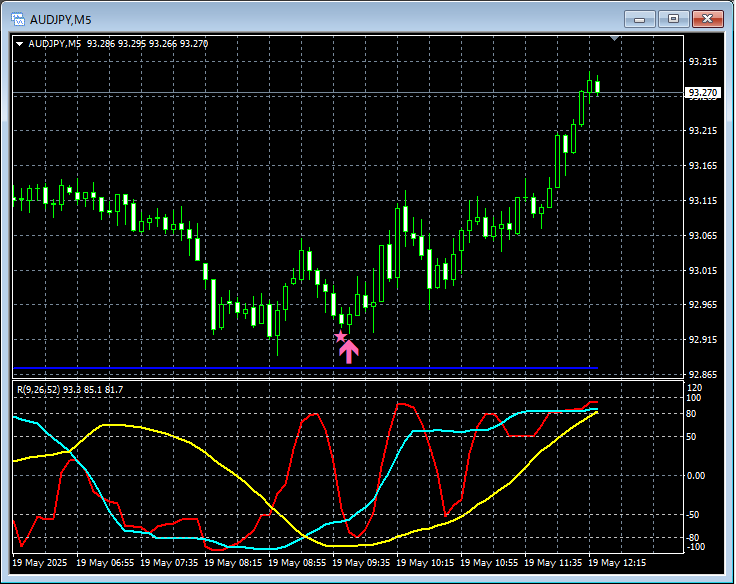
The situation of the higher timeframe is omitted. Also,Description of drilling down from higher timeframe to lower timeframe using RCIis explained in detail in the accompanying PDF, so it is also omitted here. I'm not just casually looking at the 5-minute chart.
In actual trading, when planning a strategy,understanding the higher timeframeanddrilling down from higher to lower timeframe using RCIis extremely important.
Looking at the 5-minute chart above, what is deemed important in this case isthe daily EMA21 region as a resistance/ rebound area. After that,the mBDSR (RCI two-line filter) pullback buy signallights up and the price rises substantially.
From this example,the synergy between price action around moving averages and trades based on the three RCI linesandthe signals from mBDSRis evident.
Additionally, in this example, placing the stop-loss slightly below the recent lowimproves the risk-reward of the trade.
※Note: In the charts presented in this article, for clarity, circles, lines, squares, etc., may be added, so please be aware.
Indicator that shines in combination with RCI【BODSOR・mBDSR】
and techniques・case studies (PDF) ★GogoJungle AWARD2020 Winner★
https://www.gogojungle.co.jp/tools/indicators/11836
The PDF file includes 358 items (over 1,400 pages, over 470,000 characters).
Many of them describe how to logically link higher and lower timeframes using three RCI lines, sequentially analyzing multiple lower timeframes, and ultimately waiting for pullbacks or rebounds on the lower timeframes (i.e., mBDSR signals).
Also,many of them emphasize identifying points where multiple entry reasons overlap.There are also many that focus on
Additionally,techniques to explore upside targets or downside targets using the three RCI lines are included.In the PDF explanations,
over 1,350 chartsare used.
× ![]()


