

Example of a Buy Signal on a First Touch (EUR/USD 5-minute chart) 20181224【RCI3 Main Line + mBDSR】
※Campaign ongoing until January 10, 2019.
BODSOR (mBDSR)sales page ishere.
※ BODSOR and mBDSR are indicators developed to improve the entry accuracy when using the three RCIs to execute pullbacks buying on dips or selling on rallies.
The figure below is a 5-minute EUR/USD chart.
EUR/USD 5-minute chart (as of December 24, 2018)
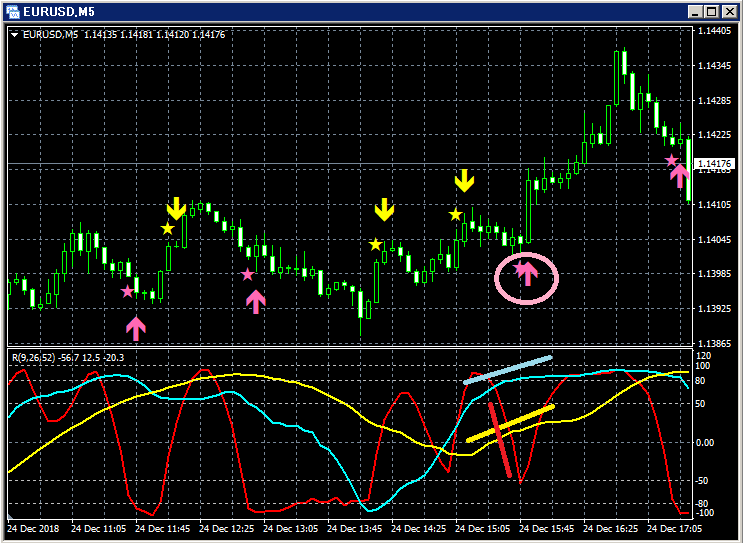
If RCI9 reverses and rises, all three RCIs may rise together in this scenario.
In other words, prices may rise strongly as well.
In such a situation,mBDSR pullback-buy signal (pink arrow circled) lights up.
Immediately after the signal lights, a large bullish candlestick appears, and thereafter the price continues to rise smoothly, which can be observed.
In this example, the reversal and rise of the declining RCI9 is confirmed after a large bullish candle forms and makes a new high
.
BODSOR (mBDSR) sales page ishere.

Twitter
https://twitter.com/RCIX3Line
Blog
http://bodsor.blog.fc2.com/
Investment Navigator+
https://fx-on.com/navi/serial/?id=359
YouTube
https://www.youtube.com/channel/UCL-g5uAlesiWVJEDtWlFvGw
USD/JPY 1-hour chart example of pullback-buy and rebound-sell signals
※Note: In charts within this article, for convenience of explanation, there may be added circles, lines, squares, etc., and we appreciate your understanding.


