

【Master RCI and win with a moving average filter!! Gold XAUUSD 20250515】Continuous mBDSR pullback buying signals
===============================================
【RCI Related】 Free Blacksun indicator and free e-book
https://www.gogojungle.co.jp/finance/navi/articles/90181
===============================================
【Mastering RCI!! Trend Reversal, Buy-the-Dip, and Selling Rallies】
Indicator that shines in combination with RCI【BODSOR・mBDSR】
and methods & case studies (PDF) ★GogoJungle AWARD2020 Winner★
https://www.gogojungle.co.jp/tools/indicators/11836
The PDF file comes with 358 items (over 1,400 pages, over 470,000 characters).
【Special Video vol.01 / Blacksun】
【Free e-book】 Offers from overseas hedge funds!? A leading Japanese RCI researcher’s trading journey
https://www.gogojungle.co.jp/finance/navi/articles/89634
【Special Video vol.02 / Blacksun】
【Definitive Guide| Mastery of RCI Analysis】 Thorough explanation of multi-time-frame & technical methods to improve win rate
https://www.gogojungle.co.jp/finance/navi/articles/89635
【Special Video vol.03 / Blacksun】
【Reason for 400+ users】 Raise trading edge with MT5 multi-time-frame analysis!
https://www.gogojungle.co.jp/finance/navi/articles/89636
mBDSR (RCI Filter)andmBDSR (Moving Average Filter)have different roles. The accompanying PDF also touches on how to use them.
Below,mBDSR (Moving Average Filter)signs are illustrated as examples.
Gold/USD XAUUSD 5-minute chart, May 15, 2025
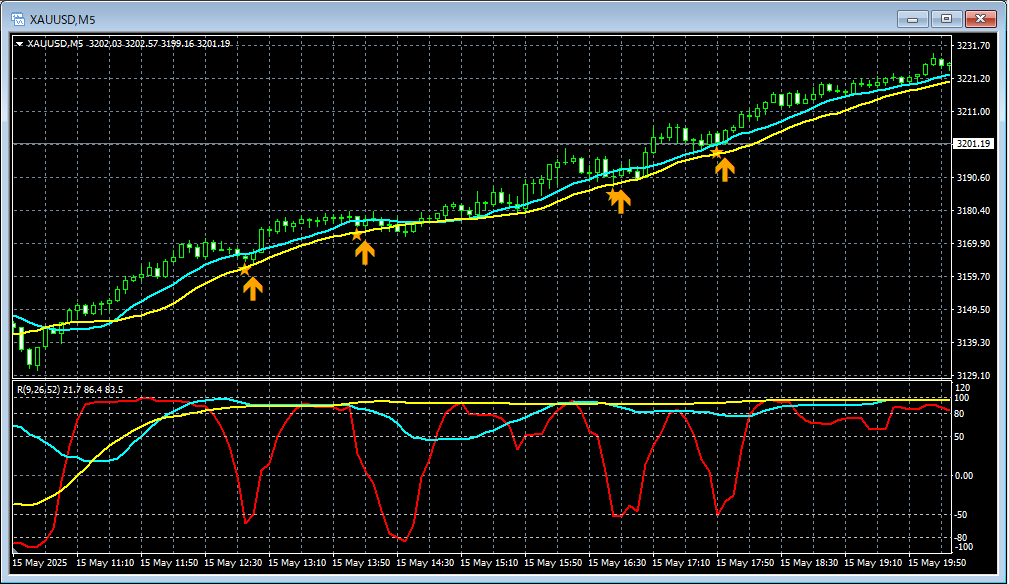
On the above 5-minute chart,mBDSR (Moving Average Filter)buy-the-dip signals light up at timely moments.
Moving Average Filter mBDSRalsoallows high-probability trades when used in conjunction with RCIs three-line breakdown from higher to lower timeframesand this is explained in theattached PDF.
※ For readability, charts in this article may include circles, lines, and rectangles.
Indicator that shines in combination with RCI【BODSOR・mBDSR】
and methods & case studies (PDF) ★GogoJungle AWARD2020 Winner★
https://www.gogojungle.co.jp/tools/indicators/11836
The PDF file comes with 358 items (over 1,400 pages, over 470,000 characters).
Most of them are summarized as examples where, by linking the higher and lower timeframes logically using the three-line RCIs, the situations of multiple lower timeframes are considered sequentially, ultimately waiting for the timing of buy-the-dip or sell-the-rally on the lower timeframe (i.e., the signals of mBDSR).
Also,many focus on capturing points where multiple entry reasons align.There are also many cases
Additionally,the method to explore upside and downside targets using three-line RCIs is included..
In the PDF explanations,are used.

× ![]()


