

【Master RCI to Win Extremely!! Gold XAUUSD】Rebound Selling Sign from the 2025/5/16 chart
=================
【RCI Related】 Free indicator and free e-book for Blacksun
https://www.gogojungle.co.jp/finance/navi/articles/90181
=================
【Master RCI!! Trend Reversals, Buy on Dips, Sell on Rallies】
Indicator that shines in combination with RCI【BODSOR・mBDSR】
and methods/case studies (PDF) ★GogoJungle AWARD2020 Winner★
https://www.gogojungle.co.jp/tools/indicators/11836
The PDF file includes 358 items (over 1,400 pages, over 470,000 characters).
【Special Video vol.01 / Blacksun】
【Free e-book】 Offer from overseas hedge funds!? One of Japan’s leading RCI researchers’ trading history
https://www.gogojungle.co.jp/finance/navi/articles/89634
【Special Video vol.02 / Blacksun】
【Definitive Guide|RCI Analysis Essentials】Thorough explanation of multi-time-frame and technical methods to improve win rate
https://www.gogojungle.co.jp/finance/navi/articles/89635
【Special Video vol.03 / Blacksun】
【Reason for surpassing 400 users】Raise trading edge with MT5 version multi-time frame analysis!
https://www.gogojungle.co.jp/finance/navi/articles/89636
Gold/USD XAUUSD 15-minute chart
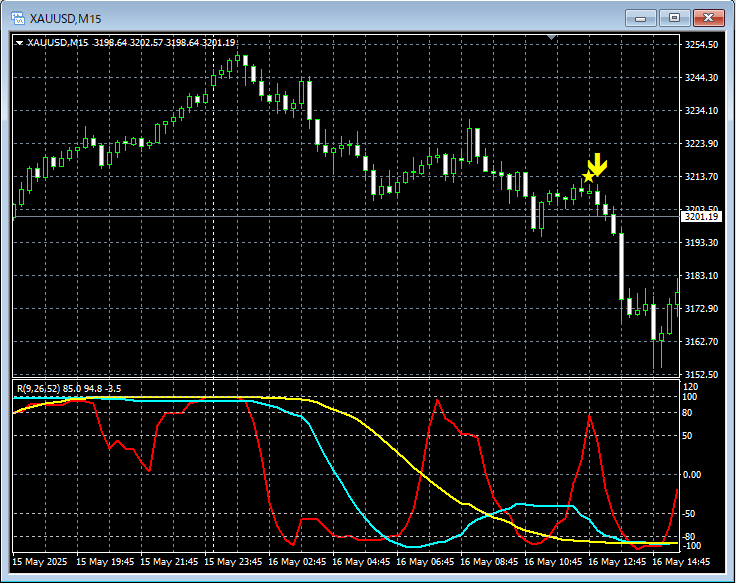
The higher-timeframe situation is omitted, but on the 4-hour chart it looks like price might resume the decline after reaching a high retrace. In the 15-minute chart above, the price alreadybroke below the swing lowandentered a downtrend. During the decline,the mBDSR (RCI two-filter) sell signal lit up and price continued to fall.
※ Please note that the charts introduced in this article may have lines, circles, squares, etc. added for explanatory convenience.
Indicator that shines in combination with RCI【BODSOR・mBDSR】
and methods/case studies (PDF) ★GogoJungle AWARD2020 Winner★
https://www.gogojungle.co.jp/tools/indicators/11836
The PDF file includes 358 items (over 1,400 pages, over 470,000 characters).
Many of them areexamples that use three RCI lines to logically link higher and lower timeframes, sequentially analyze the status of multiple lower timeframes, and ultimately wait for dip buying or rally selling signals on the lower timeframes (i.e., the mBDSR signals)..
Also,many focus on identifying points where multiple entry reasons coincide.
Furthermore,there are techniques that explore upward and downward targets using three RCI linesas well.
The explanations in the PDF includeover 1,350 chartsare used.

× ![]()


