

[Master RCI to Win with Moving Average Filter!! USD/JPY Yesterday 20250516] Buy-the-dip signal of mBDSR
=================
【RCI Related】Blacksun's Free Indicator and Free E-Books
https://www.gogojungle.co.jp/finance/navi/articles/90181
=================
【Master RCI!! Trend Reversal, Buy the Dip, Sell the Rally】
Indicators that work powerfully in combination with RCI【BODSOR・mBDSR】
and Techniques・Case Studies (PDF) ★GogoJungle AWARD2020 Winner★
https://www.gogojungle.co.jp/tools/indicators/11836
The PDF file includes 358 items (over 1,400 pages, over 470,000 characters).
【Special Video vol.01 / Blacksun】
【Free E-book】 Offers from overseas hedge funds!? One of Japan’s top RCI researchers’ trading journey
https://www.gogojungle.co.jp/finance/navi/articles/89634
【Special Video vol.02 / Blacksun】
【Definitive Guide| Mastery of RCI Analysis】Thorough explanation of multi-timeframe and technical methods to improve win rate
https://www.gogojungle.co.jp/finance/navi/articles/89635
【Special Video vol.03 / Blacksun】
【Reasons Why 400 Users Have Joined】Boost your trading edge with Multi-Time-Frame analysis on MT5!
https://www.gogojungle.co.jp/finance/navi/articles/89636
mBDSR (RCI Filter)andmBDSR (Moving Average Filter)have different roles. The accompanying PDF also covers how to use them in various situations.
Below,mBDSR (Moving Average Filter)sign examples are introduced.
USD/JPY 1-minute chart, May 16, 2025
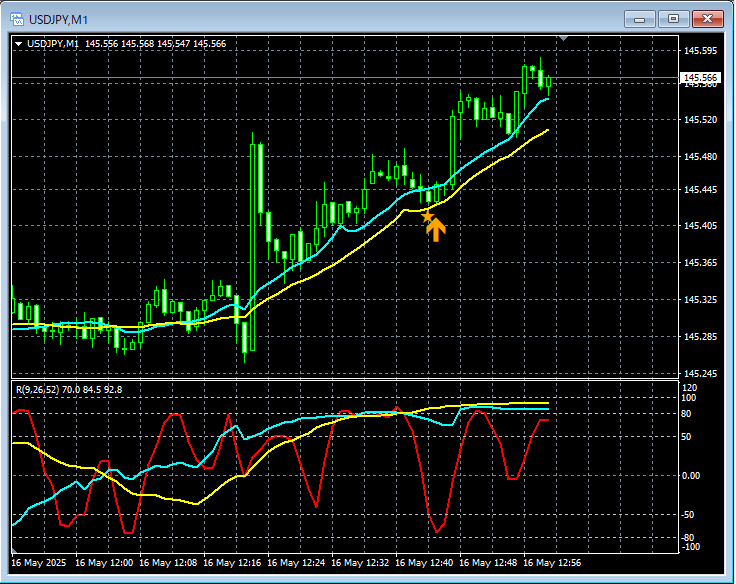
In the above 1-minute chart,mBDSR (Moving Average Filter)buy-the-dip signal lights up at an optimal timing.
Moving Average Filter mBDSRalsoworks well when integrated with the hierarchy of RCI’s three lines (top-down) from higher to lower timeframes—explained in detail in the accompanying PDF.
※Please note that in the charts introduced in this article, circles, straight lines, and rectangles may be drawn for ease of explanation.
Indicators that shine when used with RCI【BODSOR・mBDSR】
and the methodology・case studies (PDF) ★GogoJungle AWARD2020 Winner★
https://www.gogojungle.co.jp/tools/indicators/11836
The PDF file includes 358 items (over 1,400 pages, over 470,000 characters).
Most of them areexamples that link multiple higher and lower timeframes logically by using the three-line RCI, ultimately waiting for a dip or rally timing (the mBDSR signal) on the lower timeframes..
Additionally,many of them emphasize identifying points where multiple entry reasons overlap..
Also included is a technique to explore upside and downside targets using the three-line RCI.
In the PDF explanations,over 1,350 chartsare used.

× ![]()


