

[Master RCI to win with Moving Average Filter!! Yesterday's AUDJPY 20250516] mBDSR’s pullback selling signal
=================
【RCI Related】Free Indicator and Free eBooks for Blacksun
https://www.gogojungle.co.jp/finance/navi/articles/90181
=================
【Mastering RCI!! Trend Reversal, Buy-the-Dip, and Sell-the-Rally】
Indicators that excel in combination with RCI【BODSOR・mBDSR】
and strategies, case studies (PDF) ★GogoJungle AWARD2020 winner★
https://www.gogojungle.co.jp/tools/indicators/11836
The PDF file includes 358 items (over 1,400 pages, over 470,000 characters).
【Special Video vol.01 / Blacksun】
【Free eBook】 Includes offers from overseas hedge funds!? A leading RCI researcher’s trading journey in Japan
https://www.gogojungle.co.jp/finance/navi/articles/89634
【Special Video vol.02 / Blacksun】
【The Definitive Guide to RCI Analysis】Thorough explanation of multi-time-frame and technical methods to improve win rate
https://www.gogojungle.co.jp/finance/navi/articles/89635
【Special Video vol.03 / Blacksun】
【Reason for Over 400 Users】Enhance trading edge with Multi-Time-Frame analysis on MT5!
https://www.gogojungle.co.jp/finance/navi/articles/89636
mBDSR (RCI Filter)andmBDSR (Moving Average Filter)have different roles. The accompanying PDF also discusses how to use them appropriately.
Below,mBDSR (Moving Average Filter)signals are illustrated.
AUD/JPY, 1-minute chart, May 16, 2025
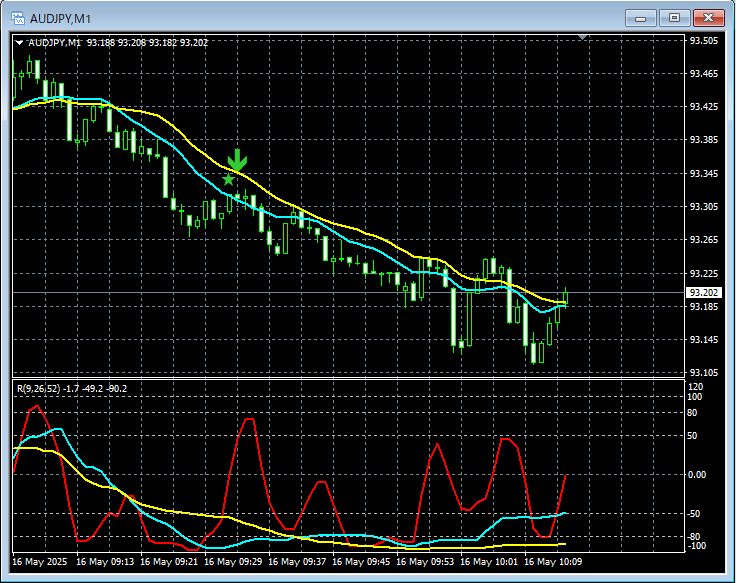
On the 1-minute chart above,mBDSR (Moving Average Filter)sell-rebound signals light up at timely points.
Moving Average Filter mBDSRalso works in conjunction with the higher-to-lower time frame downscaling using the three RCI lines, enabling higher-probability trades. The accompanying PDF explains this as well.
Note: In charts mentioned in this article, for convenience of explanation, circles, straight lines, and squares may be drawn.
Indicators that excel in combination with RCI【BODSOR・mBDSR】
and strategies, case studies (PDF) ★GogoJungle AWARD2020 winner★
https://www.gogojungle.co.jp/tools/indicators/11836The PDF file includes 358 items (over 1,400 pages, over 470,000 characters).Many of these are designed to logically link higher and lower time frames using three RCI lines, sequentially considering the conditions of multiple lower time frames, and ultimately waiting for a timing to buy on dips or sell on rallies at the lower time frames (the mBDSR signals).In addition,many items emphasize identifying points where multiple entry reasons overlap.There are also many that explore using RCI three-line analysis to assess upside and downside targets.In the PDF explanations,more than 1,350 chartsare used.
The PDF file includes 358 items (over 1,400 pages, over 470,000 characters).
Many of these are designed to logically link higher and lower time frames using three RCI lines, sequentially considering the conditions of multiple lower time frames, and ultimately waiting for a timing to buy on dips or sell on rallies at the lower time frames (the mBDSR signals).
In addition,many items emphasize identifying points where multiple entry reasons overlap.There are also many that explore using RCI three-line analysis to assess upside and downside targets.
In the PDF explanations,
more than 1,350 chartsare used.

× ![]()


