

Dollar-Yen 【mBDSR (RCI2 Three-Filters) to Win!!】 Rebound in Moving Averages From the chart of last night 2025/5/14
===============================
【RCI Related】 Free indicator and free e-book for Blacksun
https://www.gogojungle.co.jp/finance/navi/articles/90181
===============================
【Master RCI!! Trend Reversal, Buy on Dips, Sell on Rallies】
Indicators that pair with RCI for power: 【BODSOR・mBDSR】
and techniques & case studies (PDF) ★GogoJungle AWARD2020 winner★
https://www.gogojungle.co.jp/tools/indicators/11836
The PDF file includes 358 files (over 1,400 pages in total, over 470,000 characters).
【Special Video vol.01 / Blacksun】
【Free e-book】Even offers from overseas hedge funds!? One of Japan’s leading RCI researchers’ trading history
https://www.gogojungle.co.jp/finance/navi/articles/89634
【Special Video vol.02 / Blacksun】
【Essential Guide to RCI Analysis】Thorough explanation of multi-timeframe and technical methods to improve win rate
https://www.gogojungle.co.jp/finance/navi/articles/89635
【Special Video vol.03 / Blacksun】
【Reasons for surpassing 400 users】Raise trading edge with MT5 version multi-timeframe analysis!
https://www.gogojungle.co.jp/finance/navi/articles/89636
USD/JPY 5-minute chart on May 14, 2025
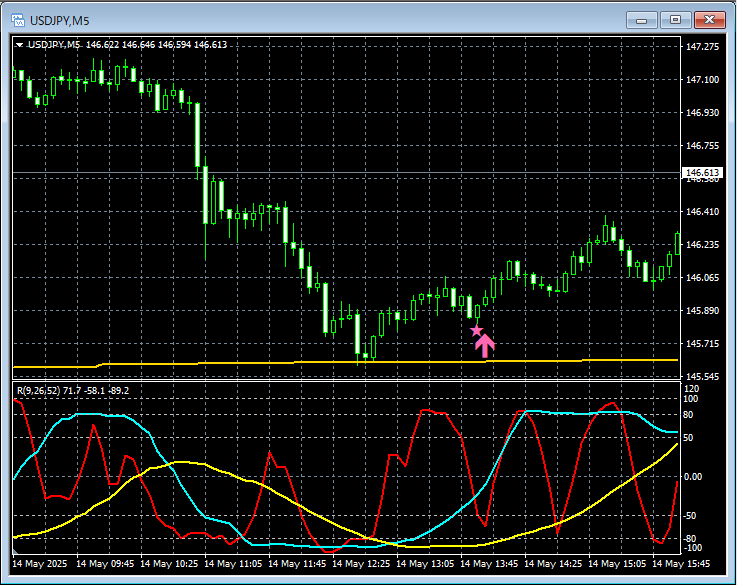
Looking at the 5-minute chart above, in this case the important factor is1-hour EMA 200pulling back to support and then rebounding. After thatmBDSR (RCI two-filter) buy-the-dip signallit up and the price rose further.
From this example,a trading method focused on rebounds at moving averagesandthe signals of mBDSRshow a strong compatibility.
※ Please note that in the charts introduced in this article, for readability we may have added circles, lines, squares, etc.
Indicator that powers with RCI【BODSOR・mBDSR】
and techniques & case studies (PDF) ★GogoJungle AWARD2020 winner★
https://www.gogojungle.co.jp/tools/indicators/11836
The PDF file includes 358 items (over 1,400 pages, over 470,000 characters).
Many of them are aboutusing three RCI lines to logically link higher and lower timeframes, examining multiple lower timeframes step by step, and ultimately waiting for pullbacks or rallies on the lower timeframes (i.e., signals from mBDSR)..
Also,many focus on identifying points where multiple entry reasons overlap..
Also included is a method for exploring upside and downside targets using three-line RCI.
In the explanations within the PDF files,more than 1,350 chartsare used.

× ![]()


