

[Master RCI and how to win with moving average filter!! Today's AUDJPY 20250514] mBDSR’s pullback selling signal
=================
【RCI Related】 Free Blacksun indicators and free e-books
https://www.gogojungle.co.jp/finance/navi/articles/90181
=================
【Master RCI!! Count on Trend Reversals, Buy Dips, Sell Rallies】
Indicators that pair with RCI for big impact【BODSOR・mBDSR】
and methods · case studies (PDF) ★GogoJungle AWARD2020 winner★
https://www.gogojungle.co.jp/tools/indicators/11836
The PDF file includes 358 documents (over 1,400 pages, over 470,000 characters).
【Special Video vol.01 / Blacksun】
【Free e-book】 Offers from overseas hedge funds too!? One of Japan’s leading RCI researchers’ trading journey
https://www.gogojungle.co.jp/finance/navi/articles/89634
【Special Video vol.02 / Blacksun】
【Preserved edition | Mastery of RCI analysis】 Thorough explanation of multi-timeframe and technical methods to boost win rate
https://www.gogojungle.co.jp/finance/navi/articles/89635
【Special Video vol.03 / Blacksun】
【Why over 400 users chose it】 Elevate trading edge with MT5 multi-timeframe analysis!
https://www.gogojungle.co.jp/finance/navi/articles/89636
mBDSR (RCI Filter)andmBDSR (Moving Average Filter)have different roles. The accompanying PDF also discusses how to use them distinctively.
Below,mBDSR (Moving Average Filter)sign examples are introduced.
AUDJPY 1-minute chart, May 14, 2025
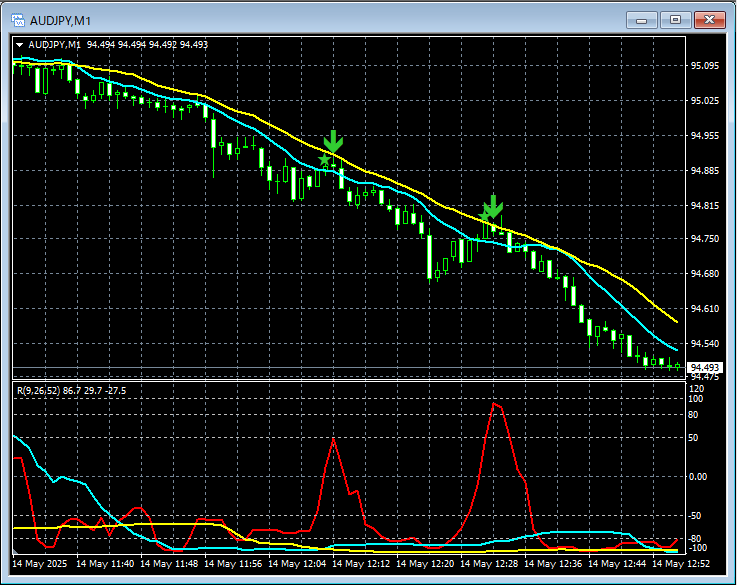
On the above 1-minute chart,mBDSR (Moving Average Filter)sell-on-rebound signals light up with good timing twice.
Moving Average Filter mBDSRalsoworks in conjunction with top-down analysis using the 3-line RCIto enable high-probability trades. The accompanying PDF also explains this area.
*Note: In this article, some charts may include added circles, lines, or rectangles for easier explanation.
Indicators that pair with RCI for big impact【BODSOR・mBDSR】
and methods · case studies (PDF) ★GogoJungle AWARD2020 winner★
https://www.gogojungle.co.jp/tools/indicators/11836
The PDF file includes 358 items (over 1,400 pages, over 470,000 characters).
Most of these are examples that link multiple timeframes logically by using the 3-line RCI to assess various lower timeframes in sequence and ultimately wait for dip buying or rally selling timing (the mBDSR signals) on the lower timeframe.
Additionally,many focus on capturing points where multiple entry reasons overlap.There are also many that explore the technique of identifying upward or downward targets using the 3-line RCI.
In the PDF explanations,more than 1,350 charts
are used.

× ![]()


