

【Master RCI and Win with a Moving Average Filter!! Today's USD/JPY 20250514】mBDSR’s rebound selling signal
=================
【RCI Related】 Free BlackSun indicators and free e-books
https://www.gogojungle.co.jp/finance/navi/articles/90181
=================
【Mastering RCI!! Trend Reversal, Buy on Dips, Sell on Rallies】
Indicator that works powerfully in combination with RCI【BODSOR・mBDSR】
and Methods / Case Studies (PDF) ★GogoJungle AWARD2020 Winner★
https://www.gogojungle.co.jp/tools/indicators/11836
The PDF file includes 358 items (over 1,400 pages, over 470,000 characters).
【Special Video vol.01 / Blacksun】
【Free e-book】Even offers from overseas hedge funds!? One of Japan’s top RCI researchers’ trading history
https://www.gogojungle.co.jp/finance/navi/articles/89634
【Special Video vol.02 / Blacksun】
【The Definitive Guide to RCI Analysis】Thorough explanation of multi-time frame and technical methods to improve win rate
https://www.gogojungle.co.jp/finance/navi/articles/89635
【Special Video vol.03 / Blacksun】
【Reason Why 400 Members Have Joined】Using MT5 multi-time frame analysis to enhance trading edge!
https://www.gogojungle.co.jp/finance/navi/articles/89636
mBDSR (RCI Filter)andmBDSR (Moving Average Filter)have different roles. The usage distinctions are also covered in the included PDF.
Below,mBDSR (Moving Average Filter)sign examples are introduced.
Dollar/Yen USDJPY 30-minute chart, May 14, 2025
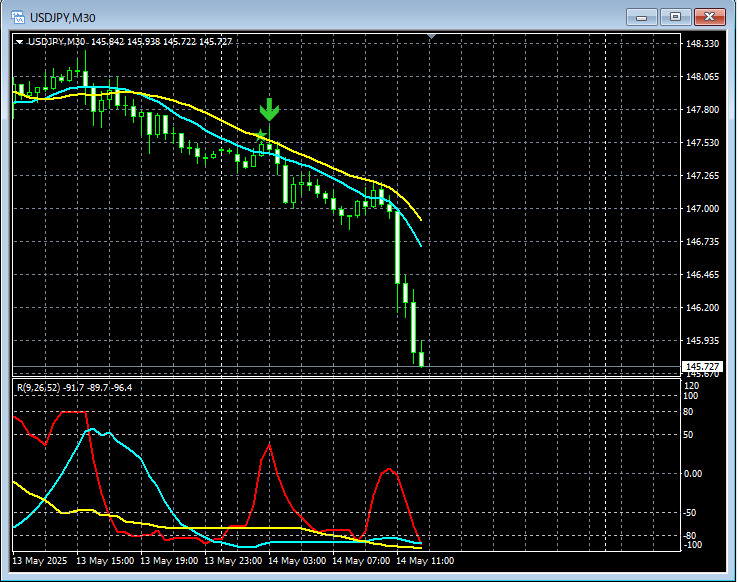
On the above 30-minute chart,the mBDSR (Moving Average Filter)reversal sell signal lights up in time.
Moving Average Filter mBDSRalsowhen used in conjunction with the higher-to-lower time frame pull-down using the 3-line RCIallows for higher-probability trades. This is also explained in the included PDF.
※ Please note that the charts introduced in this article may have been annotated with circles, lines, or rectangles for explanatory convenience.
Indicators that exert power in combination with RCI【BODSOR・mBDSR】
and Methods / Case Studies (PDF) ★GogoJungle AWARD2020 Winner★
https://www.gogojungle.co.jp/tools/indicators/11836
The PDF file includes 358 items (over 1,400 pages, over 470,000 characters).
Many of them are documented as examples that logically link higher and lower time frames using the 3-line RCI, sequentially considering multiple lower time frames, and ultimately waiting for a dip buy or rally sell signal on the lower time frame (i.e., the mBDSR signal).
Additionally,there are many that emphasize identifying points where multiple entry reasons converge..
Also included is a method for exploring ascent and descent targets using the RCI three-line setup.
In the PDF explanations,more than 1,350 chartsare used.

× ![]()


