

Dollar-Yen 【mBDSR (RCI2-band filter) wins!!】 Moving average, neck line, and selling retracement signals From this morning's chart 2025/5/14
0
===============================================
【RCI Related】 Free Blacksun indicators and free e-books
https://www.gogojungle.co.jp/finance/navi/articles/90181
===============================================
【Mastering RCI!! Trend Reversals, Buy on Dips, Sell on Rallies】
Indicators that shine when used with RCI【BODSOR・mBDSR】
and methods, case studies (PDF) ★GogoJungle AWARD 2020 winner★
https://www.gogojungle.co.jp/tools/indicators/11836
The PDF file includes 358 items (over 1,400 pages, over 470,000 characters in total).
【Special Video vol.01 / Blacksun】
【Free E-book】 From overseas hedge funds to offers?! One of Japan’s leading RCI researchers' trading history
https://www.gogojungle.co.jp/finance/navi/articles/89634
【Special Video vol.02 / Blacksun】
【Definitive Guide| Secrets of RCI Analysis】Thorough explanation of multi-timeframe and technical methods to increase win rate
https://www.gogojungle.co.jp/finance/navi/articles/89635
【Special Video vol.03 / Blacksun】
【Reason for over 400 users】Increase trading edge with MT5 version multi-timeframe analysis!
https://www.gogojungle.co.jp/finance/navi/articles/89636
USD/JPY 1-minute chart May 14, 2025
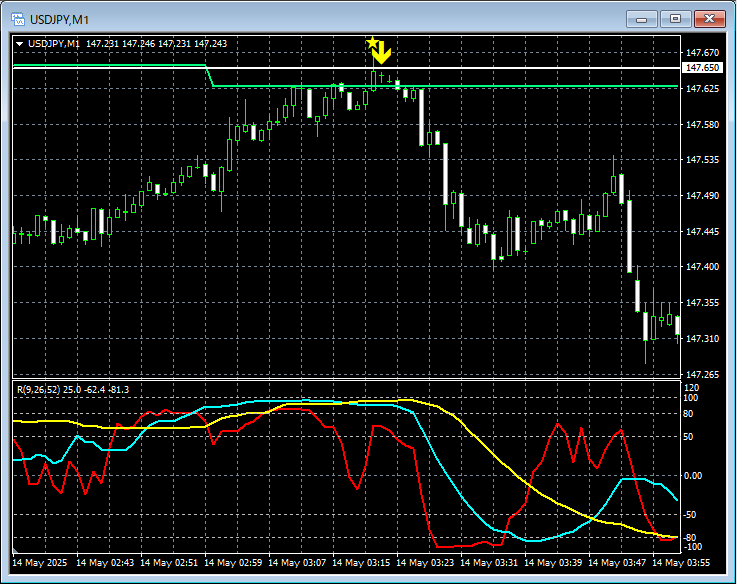
Looking at the 1-minute chart aboveNecklineand the moving average considered most important in this situation1-hour EMA21converge around the areamBDSR (RCI two-line filter) Sell signallights up and the price declines firmly.
From this example,a trading method focused on necklines and moving averagesandthe signals of mBDSRshow a high degree of compatibility.
※ Please note that in the charts referenced in this article, for convenience of explanation we may have added circles, lines, squares, etc.
The indicator【BODSOR・mBDSR】 that shines when combined with RCI
and the methods & case studies (PDF) ★GogoJungle AWARD2020 Winner★
https://www.gogojungle.co.jp/tools/indicators/11836
The PDF file includes 358 items (over 1,400 pages, over 470,000 characters in total).
Many of these areexamples that detail how to logically link higher and lower timeframes using the RCI three-line setup, then examine multiple lower-timeframe conditions sequentially, ultimately waiting for pullbacks or selloffs on the lower timeframe signals (i.e., mBDSR signals)..
Additionally,many items emphasize identifying points where multiple entry reasons overlap..
Furthermore,there are also methods that explore upside and downside targets using the RCI three-line setup..
In the PDF explanations,more than 1,350 chartsare used.

× ![]()


