

An example of trend reversal from the sign of "RCI3 head one line + mBDSR" (EUR/GBP 1-hour chart)
※Campaign is ongoing until January 10, 2019.
BODSOR (mBDSR)sales pagehere.
※ BODSOR and mBDSR are indicators developed to enhance the entry accuracy when performing pullback buying or pullback selling using the RCIs (three-line RCIs).
The figure below is the EUR/GBP 1-hour chart.
EUR/GBP 1-hour chart (December 19–24, 2018)
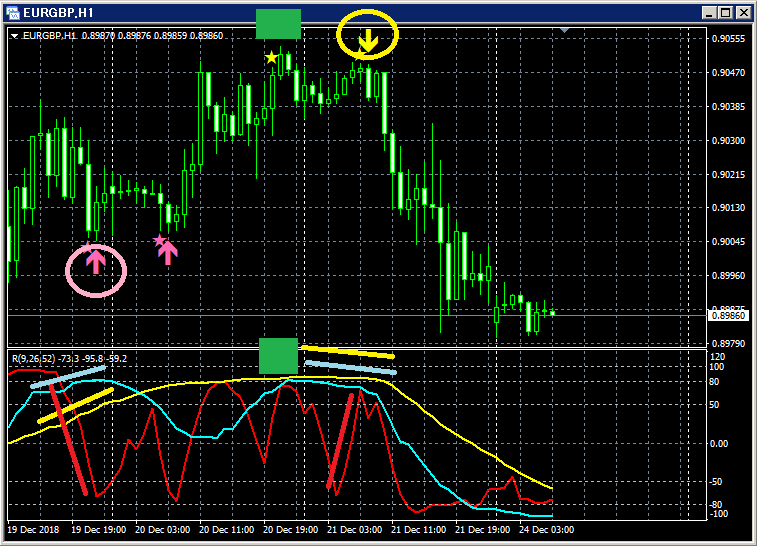
Top row:mBDSR
Bottom row: RCI three lines (red: RCI9, light blue: RCI26, yellow: RCI52)
(1) Pullback buying signal
Among the three RCI lines, only RCI9 is clearly descending.
If RCI9 reverses upward, all three RCIs may rise together.
In other words, price may rise strongly.
In such a situation,mBDSR pullback buying signal (pink arrow circled) lights up.
Immediately after the signal lights, two bullish candles occur in succession. After that, the price continues to rise smoothly without breaching the low of the candle on which the signal appeared.
(2) Rise toward a shape close to a triple top of RCI
After rising toward a shape close to a so-called "RCI triple top," the price declines.
(3) Reversal selling signal
Among the three RCI lines, only RCI9 is clearly rising.
If RCI9 reverses downward, all three RCIs may decline together.
In other words, price may fall sharply.
In such a situation,mBDSR reversal selling signal (yellow arrow circled) lights up.
Immediately after the signal lights, a bearish candle forms, and subsequently the price declines smoothly.
Regarding the above reversal selling signal, it is a common pattern where, after the RCI triple top (or close to it), RCI9 drops once and then rebounds..
The BODSOR sales page is
here.

Twitter
https://twitter.com/RCIX3Line
Blog
http://bodsor.blog.fc2.com/
Investment Navigator Plus
https://fx-on.com/navi/serial/?id=359
YouTube
https://www.youtube.com/channel/UCL-g5uAlesiWVJEDtWlFvGw
Example of pullback buying and pullback selling signals on EUR/JPY 1-hour chart
※In the charts in this article, for convenience, there may be additions of circles, lines, or rectangles to indicate elements; please understand.
× ![]()


