

Today’s GBP/JPY 5-minute chart: Buy signal on pullback [RCI 3-line + mBDSR]
※Campaign is ongoing until January 10, 2019.
BODSOR (mBDSR)sales page ishere.
※ BODSOR is an indicator developed to improve entry accuracy when using the three-line RCI to place buy orders on pullbacks or to sell on rallies.
This time, a bonus indicator 【mBDSR】 has been included with 【BODSOR】.
【mBDSR】 (bonus indicator):
The development concept is the same as for 【BODSOR】, but the arrow sign generation conditions and their calculation method are completely different.
Because more arrow signs are generated than with 【BODSOR】, the entry opportunities that could not be captured with 【BODSOR】 are more likely to be captured.
The figure below shows the GBP/USD 5-minute chart.
GBP/JPY 5-minute chart (December 24, 2018)
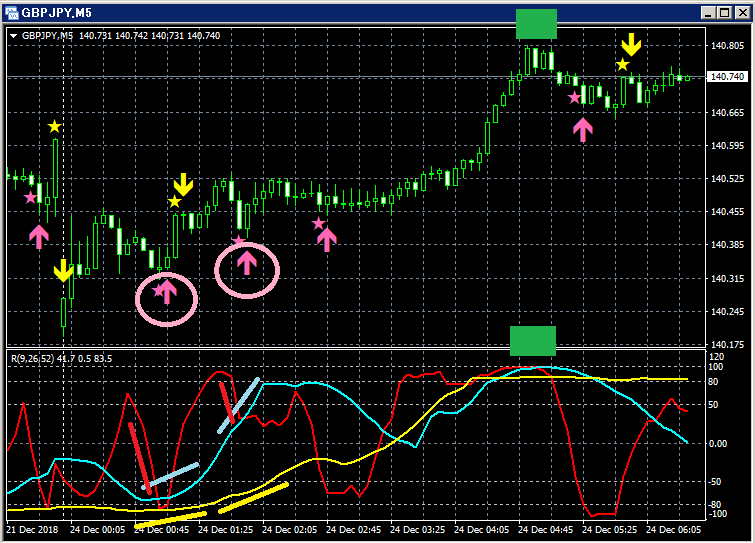
Top: mBDSR
If RCI9 turns up, all three RCI lines may rise together.
In other words, price may rise strongly.
In such a situation, the mBDSR pullback buy signals (pink arrows circled in a circle) light up twice.
Both signals light up and immediately an upward candlestick forms, and thereafter the price continues to rise smoothly
,
reaching a level close to the so-called triple-top of the RCI.
BODSOR (mBDSR) sales page ishere.

Twitter
https://twitter.com/RCIX3Line
Blog
http://bodsor.blog.fc2.com/
Investment Navi+
https://fx-on.com/navi/serial/?id=359
YouTube
https://www.youtube.com/channel/UCL-g5uAlesiWVJEDtWlFvGw
Example of pullback buy and rally sell signals on the USD/JPY 1-hour chart
※Within this article's charts, for ease of explanation, circles, lines, and rectangles may be added.
Please understand.


