

【Master RCI to Win !!】Utilize three differently purposed signals of mBDSR (RCI filter, MA filter) and R1R2S2 (2)
=================
【Free Indicator Information】
Displays RCI with BB, arrows signaling on break above BB upper limit or below BB lower limit, and shows RCI (10 or 12 bars)
https://www.gogojungle.co.jp/finance/navi/articles/70736
=================
【Master RCI!! Trend Reversal, Buy the Dip, Sell the Rally】
An indicator that shines when combined with RCI【BODSOR・mBDSR】
and methods/case studies (PDF) ★GogoJungle AWARD2020 Winner★
https://www.gogojungle.co.jp/tools/indicators/11836
【R1R2S2】 is included in the above product. For details, please read the following Investment Navi+ article.
RCI3-lines “Two-Stage Confirmation” to target trend reversals, dip buys, and pullback sells – R1R2S2 release!!
BelowmBDSR (RCI two-line filter and MA two-line filter)andR1R2S2signs are displayed simultaneously in this example.
USD/CAD 5-minute chart
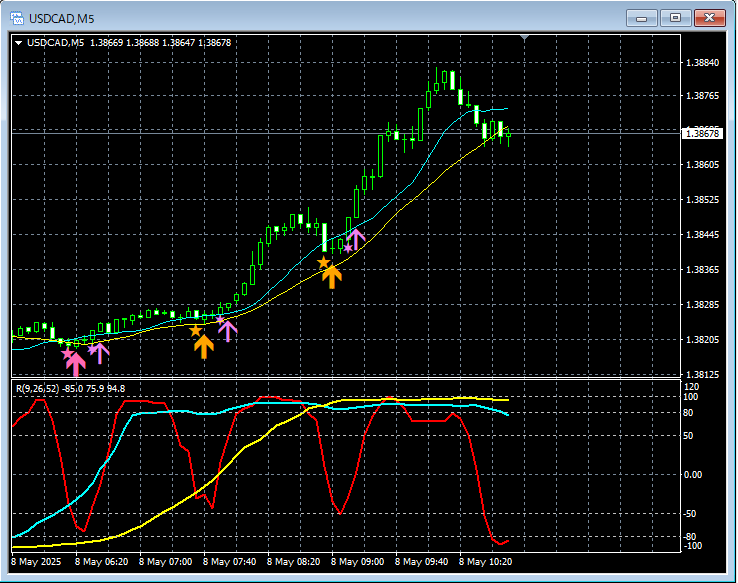
mBDSR (RCI two-line filter and MA two-line filter)andR1R2S2signs
In the above 5-minute chart,
dip-buy signals of mBDSR (RCI two-line filter)
→dip-buy signals of R1R2S2
→dip-buy signals of mBDSR (MA two-line filter)
→dip-buy signals of R1R2S2
→dip-buy signals of mBDSR (MA two-line filter)
→dip-buy signals of R1R2S2
in sequence, the signals illuminate.
In this way, mastering three signals with different roles expands the range of possible scenarios.
Indicator that shines when combined with RCI【BODSOR・mBDSR】
and methods/case studies (PDF) ★GogoJungle AWARD2020 Winner★
https://www.gogojungle.co.jp/tools/indicators/11836
PDF files are included: 358 files (over 1,400 pages, over 470,000 characters total).
Many of these are designed to logically link higher and lower timeframes by using the three RCI lines, examining multiple lower timeframes sequentially, and ultimately waiting for dip-buy or pullback Sell timings on the lower timeframes (i.e., signals of mBDSR).there are many that emphasize identifying points where multiple entry rationale align.Additionally,
There are also methods that explore upside and downside targets using the three RCI lines.
In the PDF explanations,
over 1,350 chartsare used.

× ![]()


