

【RCI3 Three-line + mBDSR】 Bitcoin / US Dollar (BTCUSD) 1-hour chart Example of a pullback sell signal
※Campaign is ongoing until January 10, 2019.
The sales page for BODSOR (mBDSR) ishere.
BODSOR is an indicator developed to improve the entry accuracy when buying on dips or selling on rallies using the RCI3-line.
This time, the [BODSOR] comes with a bonus indicator [mBDSR].
【mBDSR】(bonus indicator):
The development concept is the same as【BODSOR】, but the criteria for generating arrow signals and its calculation method are completely
different.
Because more arrow signals occur than with【BODSOR】, there is a higher possibility of capturing entry opportunities that could not be captured with【BODSOR】.
The figure below is a 1-hour chart of Bitcoin / US Dollar (BTCUSD).
Bitcoin / US Dollar (BTCUSD) 1-hour chart (December 18–21, 2018)
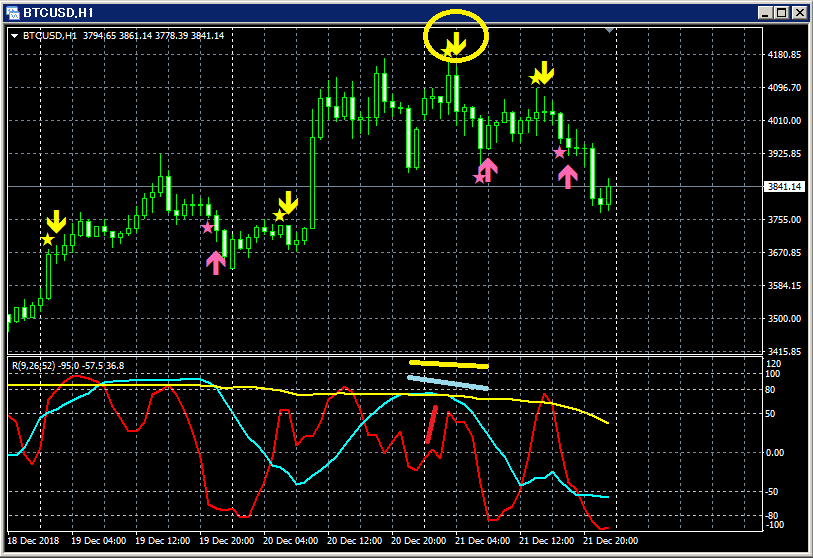
Upper section:mBDSR
Among the three RCI lines, only RCI9 is clearly rising.
If RCI9 turns down, all three RCIs may turn down, indicating a potential
strong price decline.
In such a situation,mBDSR’s pullback-sell signal (yellow arrows circled) lights up.
In this example, you can see that a bearish candlestick formed immediately after the signal, indicating the decline has begun.
The sales page for BODSOR (mBDSR) ishere.
https://twitter.com/RCIX3Line
Blog
http://bodsor.blog.fc2.com/
Invest-Navi Plus
https://fx-on.com/navi/serial/?id=359
YouTube
https://www.youtube.com/channel/UCL-g5uAlesiWVJEDtWlFvGw
Examples of buy-the-dip and sell-the-rally signals on the USD/JPY 1-hour chart
※In the charts within this article, for convenience of explanation, you may see added circles, lines, and squares.
Please note this.


