

【Master RCI!! PDF Added】A PDF collection for day trading using 5-minute chart signals
0
【Master RCI to Win Extreme!! Trend Reversal・Buying on Dips・Selling on Rallies】
Indicator【BODSOR・mBDSR】that shines when combined with RCI
Methods・Case Studies (PDF) ★GogoJungle AWARD2020 Winner★
https://www.gogojungle.co.jp/tools/indicators/11836
※This product includes 358 PDFs (over 1,400 pages in total, over 1,350 chart pages, over 470,000 characters) as methods and case studies from before.
※In addition to the above PDFs, we have added methods and case studies for 1-minute short-term trading and MT5, separately.
※Furthermore, recently, apart from the above PDFs, we added 36 PDFs (over 80 pages in total, over 80 chart pages, over 30,000 characters) for trades using 5-minute signals (day trading).
Examples of Signals for mBDSR (Two RCI Filters)
As in the above chartmBDSR (Signals with two RCI filters)not only, as shown in the chart belowmBDSR (Two MA filters) signalswill greatly expand trading opportunities. Therefore, in this newly added PDF, we also focus on explaining how to utilizemBDSR (Signals with two MA filters)in practice.
Examples of Signals for mBDSR (Two MA filters)
As of February 6, 2026,the file names and titles of PDFs added for 5-minute signals for day trading are as follows.The following list shows the titles.
(1) mBDSRhint_5M_1_20250429.pdf
Regarding reaction selling when the 15-minute chart is in a weak formation
(2) mBDSRhint_5M_2_20250429.pdf
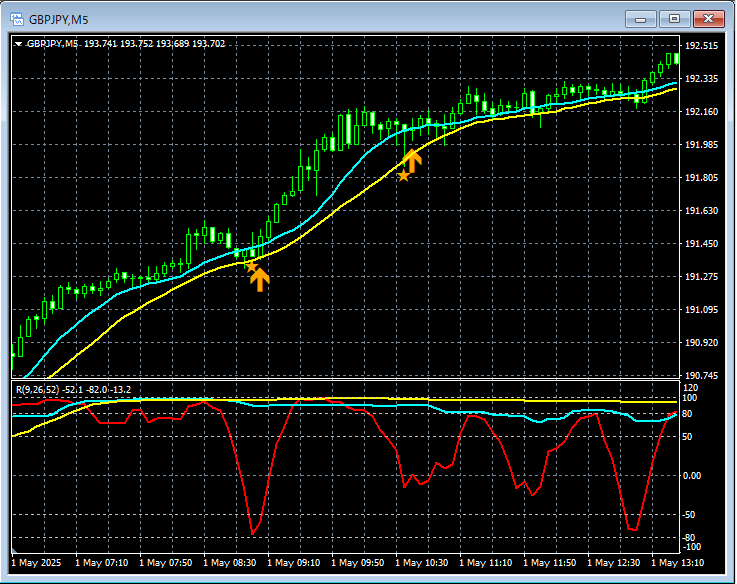
Regarding buying on the dip when the 15-minute chart is in a strong formation
(3) mBDSRhint_5M_3_20250429.pdf
Regarding buying on the dip when the 30-minute chart is in a strong formation
(4) mBDSRhint_5M_4_20250505.pdf
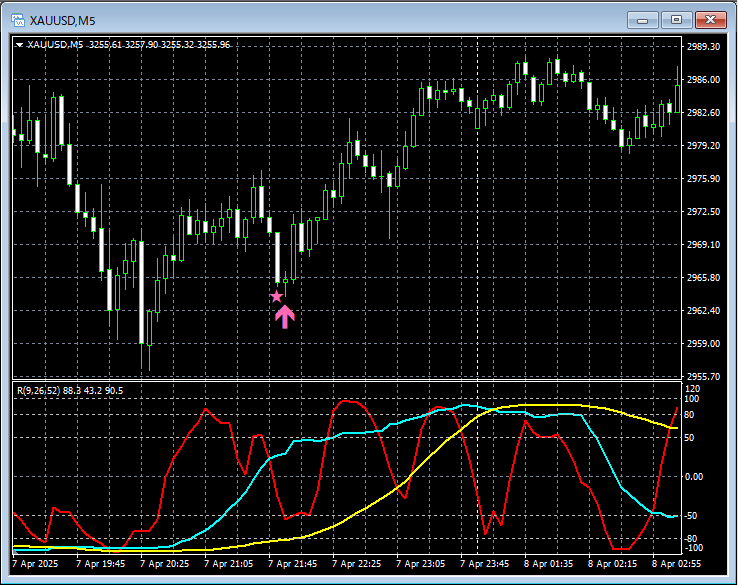
Regarding buying on the dip when the 30-minute chart is in a strong formation (Gold)
(5) mBDSRhint_5M_5_20250505.pdf
Consideration of reaction selling from the 30-minute short-term RCI high area
(6) mBDSRhint_5M_6_20250502.pdf
Examples of reaction selling when the 15-minute chart is in a weak formation
(7) mBDSRhint_5M_7_20250502.pdf
Reaction selling considerations when the 30-minute chart is weak (pattern using MA filters) (1)
(8) mBDSRhint_5M_8_20250504.pdf
Reaction selling considerations when the 30-minute chart is weak (Gold)
(9) mBDSRhint_5M_9_20250504.pdf
Reaction selling considerations when the 15-minute chart is weak (also paying attention to moving averages)
(10) mBDSRhint_5M_10_20250505.pdf
Reaction selling considerations when the 30-minute chart is weak
(11) mBDSRhint_5M_11_20250505.pdf
Buying on the dip when the 30-minute chart is in a strong formation
(12) mBDSRhint_5M_12_20250505.pdf
Buying on the dip when the 30-minute chart is rising from short-term RCI bottom
(13) mBDSRhint_5M_13_20250506.pdf
On the 1-hour chart, looking at moving averages for lower-timeframe dip selling
(14) mBDSRhint_5M_14_20250506.pdf
On the 1-hour chart, looking at moving averages for lower-timeframe dip selling (with emphasis on moving averages)
(15) mBDSRhint_5M_15_20250506.pdf
Buying on dips when the 30-minute RCI double bottom forms (watch for support)
(16) mBDSRhint_5M_16_20250507.pdf
Reaction selling near the breakout high of higher timeframes
(17) mBDSRhint_5M_17_20250617V2.pdf
Regarding reaction selling when the 30-minute chart is weak (Gold)
(18) mBDSRhint_5M_18_20250508.pdf
Reaction selling from the 30-minute short-term RCI top area (also watch moving averages)
(19) mBDSRhint_5M_19_20250508.pdf
Reaction selling from the 30-minute short-term RCI top area (Gold)
(20) mBDSRhint_5M_20_20250508.pdf
Reaction selling from the 30-minute short-term RCI top area (also watch for support breaks)
(21) mBDSRhint_5M_21_20250509.pdf
Buying on dips when the 30-minute short-term RCI is rising (watch moving averages)
(22) mBDSRhint_5M_22_20250509.pdf
Buying on dips when the 15-minute chart is strong (watch counter-trend lines)
(23) mBDSRhint_5M_23_20250509.pdf
Buying on dips when the 30-minute chart is strong (watch resistance lines)
(24) mBDSRhint_5M_24_20250511.pdf
Reaction selling when the 30-minute chart is weak (pattern using MA filters) (2)
(25) mBDSRhint_5M_25_20250511.pdf
Buying on dips when the 30-minute chart is strong (pattern using MA filters) (1)
(26) mBDSRhint_5M_26_20250511.pdf
Buying on dips when the 30-minute chart is strong (pattern using MA filters) (2)
(27) mBDSRhint_5M_27_20250511.pdf
Buying on dips when the 30-minute chart is strong (pattern using MA filters) (3)
(28) mBDSRhint_5M_28_20250511.pdf
Buying on dips when the 30-minute chart is strong (pattern using MA filters) (4)
(29) mBDSRhint_5M_29_20250511.pdf
Reaction selling when the 30-minute chart is weak (pattern using MA filters) (3)
(30) mBDSRhint_5M_30_20250511.pdf
Reaction selling when the 30-minute chart is weak (pattern using MA filters) (4)
(31) mBDSRhint_5M_31_20250511.pdf
Buying on dips when the 30-minute chart is strong (pattern using MA filters) (5)
(32) mBDSRhint_5M_32_20250511.pdf
Reaction selling when the 30-minute chart is weak (pattern using MA filters) (5)
(33) mBDSRhint_5M_33_20250512.pdf
Buying on dips when the 30-minute chart is strong (pattern using MA filters) (6)
(34) mBDSRhint_5M_34_20250512.pdf
Reaction selling when the 30-minute chart is weak (pattern using MA filters) (6)
(35) mBDSRhint_5M_35_20250512.pdf
Reaction selling when the 30-minute chart is weak (pattern using MA filters) (7)
(36) mBDSRhint_5M_36_20250512.pdf
Buying on dips when the 30-minute chart is strong (pattern using MA filters) (7)
(37) mBDSRhint_5M_37_20250611.pdf
Reaction selling when the 30-minute chart is weak (also watch for double tops)
(38) mBDSRhint_5M_38_20250612.pdf
Reaction selling when the 30-minute chart is weak (use together with mBDSR and R1R2S2)
(39) mBDSRhint_5M_39_20250626.pdf
Example of buying on dips when the 30-minute chart is strong
(40) mBDSRhint_5M_40_20250626.pdf
Reaction selling when the 30-minute chart is weak (watch resistance, utilize R1R2S2)
(41) mBDSRhint_5M_41_20250626.pdf
Reaction selling examples on lower-timeframes when the 30-minute chart is weak
(42) mBDSRhint_5M_42_20250630.pdf
Lower-timeframe responses at a 4-hour level dip buying
(43) mBDSRhint_5M_43_20250630.pdf
Reaction selling on the 1-hour chart when it's weak
(44) mBDSRhint_5M_44_20250630.pdf
Examples of lower-timeframe reaction selling when the 30-minute chart is weak
(45) mBDSRhint_5M_45_20250701.pdf
Examples of lower-timeframe buying on dips when the 30-minute chart is strong
(46) mBDSRhint_5M_46_20250505.pdf
Reaction selling from the latest high on the 1-hour chart
(47) mBDSRhint_5M_47_20250701.pdf
When the 30-minute chart is strong, buying on dips (MA-filtered) (8)
(48) mBDSRhint_5M_48_20250702.pdf
Reaction selling when the 30-minute chart is weak (watch for support breaks)
(49) mBDSRhint_5M_49_20250702.pdf
Reaction selling from the 30-minute short-term RCI top area (watch moving averages)
(50) mBDSRhint_5M_50_20250702.pdf
Examples of lower-timeframe responses after the 30-minute reversal signal lights up
(51) mBDSRhint_5M_51_20260205.pdf
Buying on dips from the 30-minute short-term RCI bottom area (also pay attention to support lines and pin bars)
Indicator【BODSOR・mBDSR】that shines when combined with RCI
Methods・Case Studies (PDF) ★GogoJungle AWARD2020 Winner★
https://www.gogojungle.co.jp/tools/indicators/11836
PDF files: 358 items (over 1,400 pages in total, over 470,000 characters)
Most of them arecollections that structure how to logically link multiple lower-timeframes using three-line RCI, examining the states of multiple lower timeframes sequentially, and ultimately waiting for the timing to buy on dips or sell on rallies on the lower timeframes (i.e., the mBDSR signals)..
Also,many focus on capturing points where multiple entry reasons coincide..
Additionally,it includes methods for exploring upside/downside targets using three-line RCI..
In the PDF explanations,over 1,350 chartsare used.

× ![]()


