

[Win with mBDSR (RCI2 本フィルター)] Important moving average and short-selling signal that are emphasized
===================================
【RCI Related】 Free indicator and free e-book for Blacksun
https://www.gogojungle.co.jp/finance/navi/articles/90181
===================================
【Perfecting RCI!! Trend Reversal, Buy on Dips, Sell on Rallies】
Indicator【BODSOR・mBDSR】 that excels in combination with RCI
and methods & case studies (PDF) ★GogoJungle AWARD2020 winner★
https://www.gogojungle.co.jp/tools/indicators/11836
The PDF file includes 358 items (over 1,400 pages, over 470,000 characters).
【Special Video vol.01 / Blacksun】
【Free e-book】 Offers from overseas hedge funds!? A trade history of one of Japan’s top RCI researchers
https://www.gogojungle.co.jp/finance/navi/articles/89634
【Special Video vol.02 / Blacksun】
【The Definitive Guide|RCI Analysis】Thorough explanation of multi-timeframe trading techniques to improve win rate
https://www.gogojungle.co.jp/finance/navi/articles/89635
【Special Video vol.03 / Blacksun】
【Why 400 users chose it】Raise trading edge with MT5 multi-timeframe analysis!
https://www.gogojungle.co.jp/finance/navi/articles/89636
USD/JPY (CADJPY) 5-minute chart
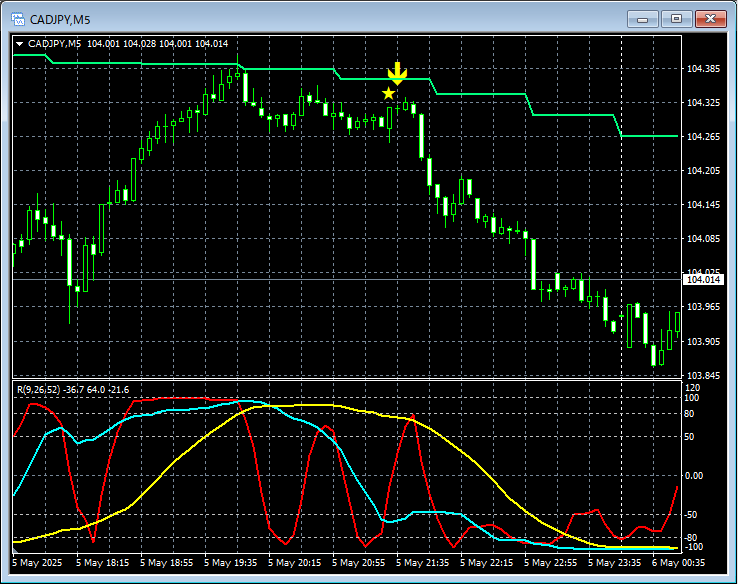
The higher timeframe context is omitted. Looking at the 5-minute chart above, what is deemed most important in this case isthe 1-hour EMA21which rose toward the vicinity and then showed signs of turning down, andthe return-sell signal of mBDSR (two RCI filters)which lit up and pushed the price down steadily.
From this example,a trading method focused on moving averagesandthe signals of mBDSRshow a high degree of compatibility.
※For convenience in explanations, charts in this article may include additions such as circles, lines, or rectangles.
Indicator that is powerful in combination with RCI【BODSOR・mBDSR】
and methods & case studies (PDF) ★GogoJungle AWARD2020 winner★
https://www.gogojungle.co.jp/tools/indicators/11836
The PDF file includes 358 items (over 1,400 pages, over 470,000 characters).
Many of them are summarized as examples that link multiple higher and lower timeframes logically using the RCI three-line setup, and ultimately wait for a dip buy or a pullback sell signal on the lower timeframe (i.e., mBDSR signals).
In addition,there are many that emphasize catching points where multiple entry reasons overlap.There are also entries that explore price targets for upward and downward moves using the RCI three-line setup.
In the explanations within the PDF files,more than 1,350 chartsare used.

× ![]()


