

[RCI3 Three-line + mBDSR] Euro-Dollar 15-minute Chart Retracement Sell Signal
※Campaign is ongoing until January 10, 2019.
The BODSOR sales page is here.
※ BODSOR is an indicator developed to improve entry accuracy when making buy-on-dips or sell-ons on pullbacks using three RCI lines.
This time, an extra indicator「mBDSR」has been bundled with【BODSOR】.
【mBDSR】 (extra indicator):
Its development concept is the same as【BODSOR】, but the arrow signal generation conditions and its calculation method are completely
different.
Because more arrow signals occur than with【BODSOR】, it increases the likelihood of capturing entry opportunities that【BODSOR】couldn’t catch.
The figure below is the EURUSD 15-minute chart.
EURUSD 15-minute chart (December 21, 2018)
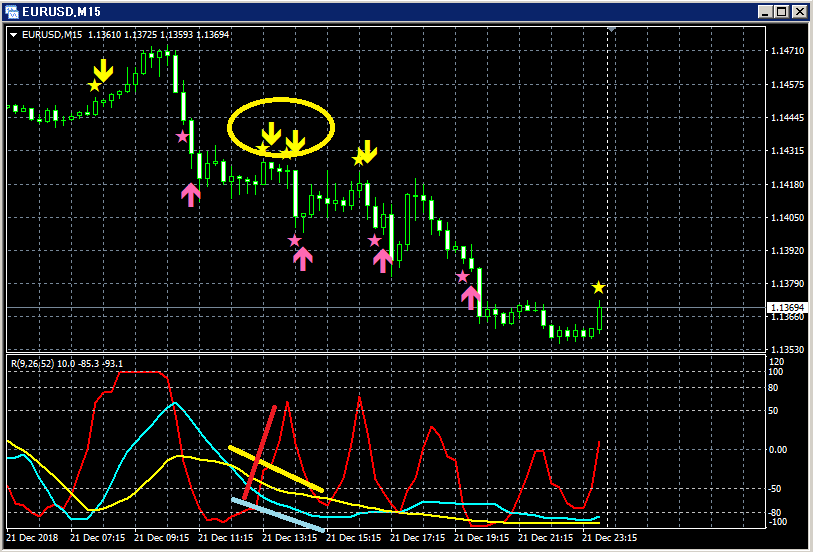
Among the three RCI lines, only RCI9 is clearly rising.
If RCI9 reverses down, all three RCI lines may move downward.
In other words, price could also move strongly downward.
In such a scenario,mBDSR’s sell-on-rebound signal (yellow arrows circled) lights up.
After the signal lights, the price continues to fall smoothly, as can be seen.
Note that, ultimately, the reversal of the rising RCI9 is confirmed after a large bearish candlestick forms and the low is updated.
This occurs later than initially expected.
The BODSOR sales page is here.

Twitter
https://twitter.com/RCIX3Line
Blog
http://bodsor.blog.fc2.com/
Investment Navigator Plus
https://fx-on.com/navi/serial/?id=359
YouTube
https://www.youtube.com/channel/UCL-g5uAlesiWVJEDtWlFvGw
Example of a buy-on-dip and sell-on-rally signal on USD/JPY 1-hour chart
※Some charts in this article may include circles, straight lines, and rectangles for explanatory convenience,
so please understand.


