

【RCI3 Three-Line+mBDSR】 From a dip-buy signal to a triple top rise USDCAD 30-minute chart 20181221
0
※Campaign is ongoing until January 10, 2019.
BODSOR (mBDSR) sales page ishere.
※ BODSOR is an indicator developed to improve entry accuracy when executing buy on dips or sell on rallies using the RCI 3-line.
This time, an extra indicator 【mBDSR】 has been included with【BODSOR】.
【mBDSR】 (extra indicator):
The development concept is the same as for【BODSOR】, but the conditions for generating arrow signals and their calculation method are completely
different.
There are more arrow signals than in BODSOR, so the entry opportunities that could not be captured by BODSOR may be captured more frequently.
The figure below is the 30-minute chart of USDCAD.
USDCAD 5-minute chart (December 22, 2018)
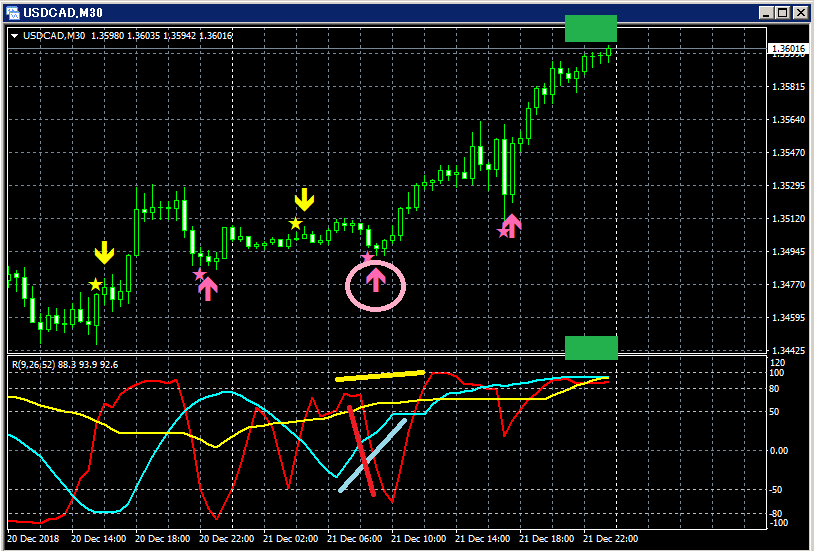
Upper panel:mBDSR
Among the three RCI lines, only RCI9 is clearly declining.
If RCI9 reverses and rises, all three RCI lines may rise together.
In other words, price may rise strongly as well.
In such a situation,mBDSR buy-on-dip signal (pink arrows encircled) lights up.
After the signal lights up, price rises smoothly and rises toward a shape close to the so-called threefold RCI ceiling.
It can be seen.
Right after the signal lights up, a small bearish candle occurs, but the price retracement is about 5–6 pips, and
afterward, it rises about 100 pips.
Note that the reversal of the downward-moving RCI9 to confirm occurs after three bullish candles appear following the buy-on-dip signal.
three candles.
BODSOR (mBDSR) sales page ishere.

Twitter
https://twitter.com/RCIX3Line
Blog
http://bodsor.blog.fc2.com/
Investment Navi+
https://fx-on.com/navi/serial/?id=359
YouTube
https://www.youtube.com/channel/UCL-g5uAlesiWVJEDtWlFvGw
Examples of buy on dips and sell on rallies for USD/JPY on the 1-hour chart
※Note: In this article's charts, for convenience of explanation, items such as circles, straight lines, and rectangles may be drawn, so please understand.
× ![]()


