

[Win with mBDSR (RCI2 Full Filter)!] Moving averages we focus on, retracement highs, and pullback buying signals
=================
【RCI Related】 Free indicator and free e-books for Blacksun
https://www.gogojungle.co.jp/finance/navi/articles/90181
=================
【Mastering RCI!! Trend Reversal, Buy on Dips, Sell on Rallies】
Indicators that work powerfully in combination with RCI【BODSOR・mBDSR】
and techniques / case studies (PDF) ★GogoJungle AWARD2020 winner★
https://www.gogojungle.co.jp/tools/indicators/11836
The PDF files include 358 items (over 1,400 pages, over 470,000 characters).
【Special Video vol.01 / Blacksun】
【Free E-book】 Offers from overseas hedge funds?! One of the leading RCI researchers' trading journey in Japan
https://www.gogojungle.co.jp/finance/navi/articles/89634
【Special Video vol.02 / Blacksun】
【The Definitive Guide to RCI Analysis】Thorough explanation of multi-time frame trading methods to improve win rate
https://www.gogojungle.co.jp/finance/navi/articles/89635
【Special Video vol.03 / Blacksun】
【Reason why 400 users have joined】Enhance trading edge with MT5 multi-time frame analysis
https://www.gogojungle.co.jp/finance/navi/articles/89636
AUD/USD 30-minute chart
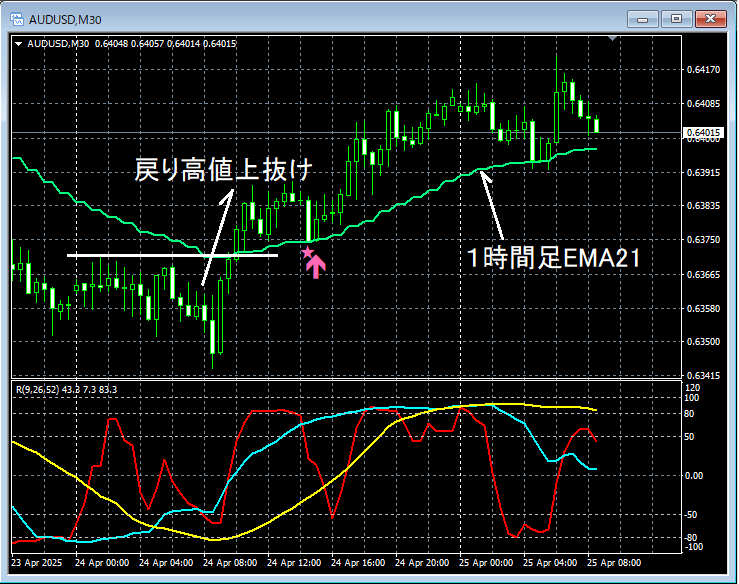
Looking at the 30-minute chart above,the return highandthe 21-period EMA on the 1-hour chartoverlapped, then broke upward,to near the 1-hour EMA21where it pulled backmBDSR (RCI two-filter) buy-the-dip signallit up and the price rose steadily.
From this example,you can see the strong compatibility between trading methods that focus on Dow Theory and moving averagesandthe signals of mBDSR.
※Please note that in charts introduced in this article, for ease of explanation, circles, straight lines, and squares may have been added.
Indicators that work powerfully in combination with RCI【BODSOR・mBDSR】
and techniques / case studies (PDF) ★GogoJungle AWARD2020 winner★
https://www.gogojungle.co.jp/tools/indicators/11836
The PDF files include 358 items (over 1,400 pages, over 470,000 characters).
Most of them are constructed to logically link higher and lower timeframes using the three RCI lines, examine the conditions of multiple lower timeframes successively, and ultimately wait for pullbacks or pullbacks timing (i.e., the mBDSR signals) on the lower timeframes.
In addition,many emphasize capturing points where multiple entry reasons coincide..
Also included are methods for exploring upside and downside targets using the three RCI lines.
In the PDF explanations,more than 1,350 chartsare used.

× ![]()


