

[mBDSR (RCI2 Full Filter) Win!!] Counter-trend line and pullback buy signal
=================
【RCI Related】Free indicator and free e-book for Blacksun
https://www.gogojungle.co.jp/finance/navi/articles/90181
=================
【Mastering RCI!! Trend Reversal, Buy on Dip, Sell on Rallies】
Indicators that pair with RCI for great effectiveness【BODSOR・mBDSR】
and techniques, case studies (PDF) ★GogoJungle AWARD2020 winner★
https://www.gogojungle.co.jp/tools/indicators/11836
The PDF file contains 358 items (over 1,400 pages, over 470,000 characters in total).
【Special Video vol.01 / Blacksun】
【Free e-book】 Opportunities from overseas hedge funds!? A career of trading by a top domestic RCI researcher
https://www.gogojungle.co.jp/finance/navi/articles/89634
【Special Video vol.02 / Blacksun】
【 Definitive Guide | The Essence of RCI Analysis】 Thorough explanation of multi-time-frame and technical methods to boost win rate
https://www.gogojungle.co.jp/finance/navi/articles/89635
【Special Video vol.03 / Blacksun】
【Reason for 400 users and more】 Elevate trading edge with MT5 multi-time-frame analysis
https://www.gogojungle.co.jp/finance/navi/articles/89636
USD/JPY 30-minute chart
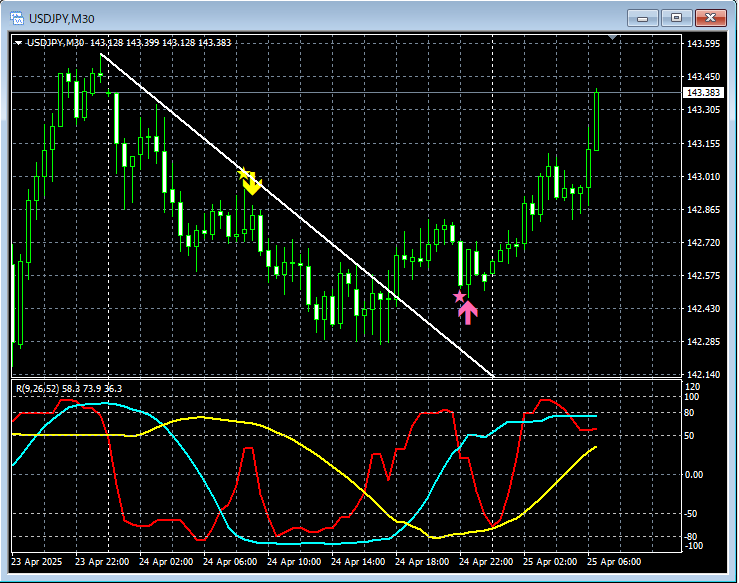
Looking at the 30-minute chart above,Counter-trend lineAfter breaking above, on the pullbackmBDSR (two RCI lines filtered) buy-the-dip signallights up and the price rises steadily.
From this example,a trading method focused on the counter-trend lineandthe compatibility with mBDSR signalsare evident.
※ Please note that the charts mentioned in this article may have lines, straight lines, or rectangles added for ease of explanation.
Indicators that pair with RCI for great effectiveness【BODSOR・mBDSR】
and techniques, case studies (PDF) ★GogoJungle AWARD2020 winner★
https://www.gogojungle.co.jp/tools/indicators/11836
The PDF file contains 358 items (over 1,400 pages, over 470,000 characters in total).
Most of these are examples that break down, using three-line RCI to logically link higher and lower timeframes, to sequentially analyze the state of multiple lower-timeframe charts and finally wait for pullbacks or rallies on the lower timeframe signals of mBDSR.
Also,many of them focus on identifying points where multiple entry reasons overlap.There are also many that include methods for exploring upside and downside targets using the three-line RCI.
In the PDF explanations,
more than 1,350 chartsare used.

× ![]()


