

[Win with mBDSR (RCI2 full filter)!] Moving average lines that are emphasized, and buy-the-dip signals and sell-the-rebound signals.
=================
【RCI Related】 Blacksun's Free Indicator and Free eBooks
https://www.gogojungle.co.jp/finance/navi/articles/90181
=================
【Master RCI!! Trend Reversals, Buy-the-D dips, Sell the Rallies】
Indicators that work powerfully in combination with RCI【BODSOR・mBDSR】
and Methods & Case Studies (PDF) ★GogoJungle AWARD 2020 recipient★
https://www.gogojungle.co.jp/tools/indicators/11836
The PDF file includes 358 items (over 1,400 pages, over 470,000 characters).
【Special Video vol.01 / Blacksun】
【Free eBook】Also offers from overseas hedge funds!? A top-tier Japan RCI researcher’s trading history
https://www.gogojungle.co.jp/finance/navi/articles/89634
【Special Video vol.02 / Blacksun】
【The Ultimate Guide| RC I Analysis】Thorough explanation of multi-timeframe analysis and technical methods to improve win rate
https://www.gogojungle.co.jp/finance/navi/articles/89635
【Special Video vol.03 / Blacksun】
【Reasons for surpassing 400 users】Elevate trading edge with MT5 version multi-timeframe analysis
https://www.gogojungle.co.jp/finance/navi/articles/89636
EURUSD - Euro Dollar 15-minute chart
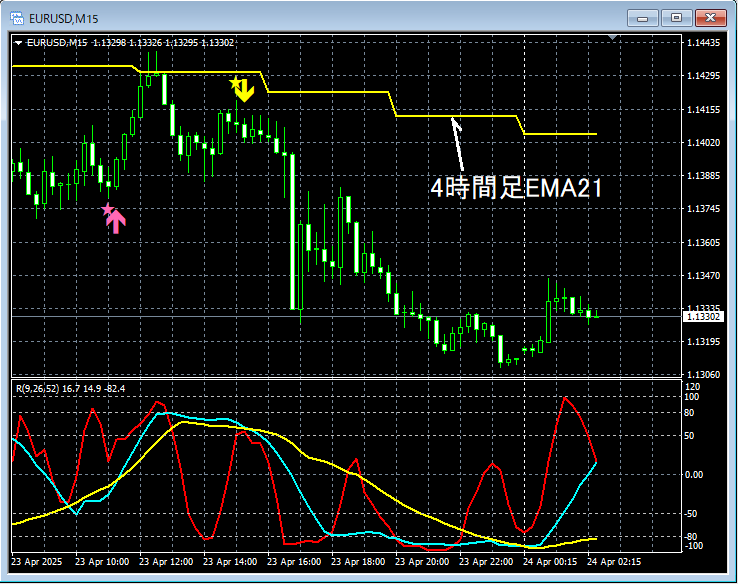
Looking at the 15-minute chart above,the mBDSR (RCI two-filter) Buy-the-Dip signallights upnear the 4-hour EMA21and rises. Then pulls back.The mBDSR (RCI two-filter) Sell-the-Rally signallights up and the price falls further.
From this example,a trading method focused on moving averagesand thesignals of mBDSRshow a high level of compatibility.
※Please note that in the charts introduced in this article, for ease of explanation, circles, lines, and squares may have been added.
Indicators that work powerfully in combination with RCI【BODSOR・mBDSR】
and Methods & Case Studies (PDF) ★GogoJungle AWARD 2020 recipient★
https://www.gogojungle.co.jp/tools/indicators/11836
The PDF file includes 358 items (over 1,400 pages, over 470,000 characters).
Most of these are written to logically link higher and lower timeframes using the RCI 3-line, and to sequentially consider the situation of multiple lower timeframes, ultimately waiting for the timing of dip buying or pullback selling on the lower timeframes (i.e., the signals of mBDSR).
Additionally,many items focus on identifying points where multiple entry basis coincide.There are also many that explore techniques using the RCI 3-line to identify ascent and descent targets.
In the explanations within the PDF files,
over 1,350 chartsare used.

× ![]()


