

【Master RCI!!】Enjoy a 1-minute short-term trade (scalping) (24) Resistance zone and selling signals on pullbacks
=================
【Free Indicator Information】
Displays RCI with BB, arrows signaled when breaking above the upper BB or below the lower BB, displays RCI (10 or 12 bars)
https://www.gogojungle.co.jp/finance/navi/articles/70736
=================
【Master RCI!! Trend Reversal, Buy on Dips, Sell on Rallies】
Indicators that work powerfully in combination with RCI【BODSOR・mBDSR】
and methods & case studies (PDF) ★GogoJungle AWARD2020 winner★
https://www.gogojungle.co.jp/tools/indicators/11836
※This product includes, in addition to the conventional methods & case studies, 358 PDFs (totaling over 1,400 pages, over 1,350 chart images, and over 470,000 characters).
※Recently, in addition to the PDFs above, 52 PDFs for 1-minute short-term trading (scalping) have been added (methods & case studies: total over 135 pages, over 130 charts, over 50,000 characters).
【Master RCI!!】PDF collection for 1-minute short-term trading (scalping)
https://www.gogojungle.co.jp/finance/navi/articles/88762
For the added PDFs aimed at 1-minute short-term trading, please refer to the above Investment Navi+ article for the file names and titles.
USDJPY 1-minute chart April 21, 2025
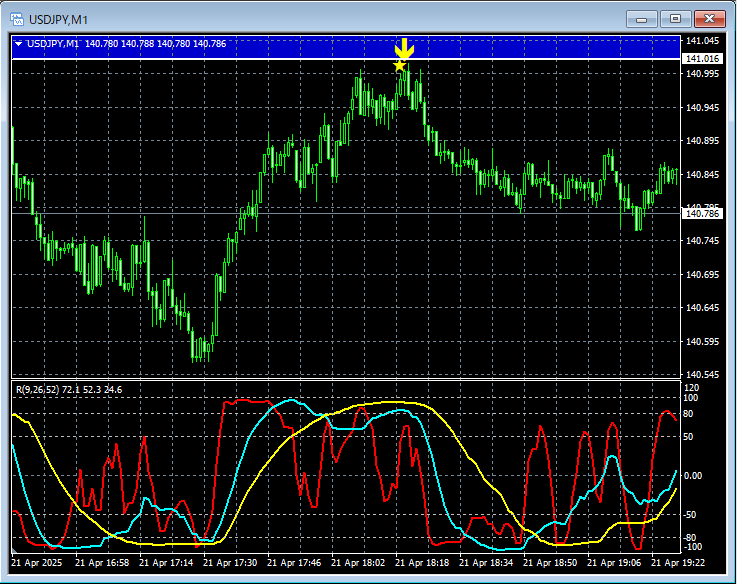
Displays RCI with BB, arrows signaled when breaking above the upper BB or below the lower BB
and methods & case studies (PDF) ★GogoJungle AWARD2020 winner★
https://www.gogojungle.co.jp/tools/indicators/11836
The PDF file includes 358 items (over 1,400 pages, over 470,000 characters).
Many of them are structured as follows: using three RCI lines to logically link higher and lower timeframes, sequentially evaluating multiple lower-timeframe conditions, and ultimately waiting for timing signals for buying on dips or selling on rallies on the lower timeframe (i.e., mBDSR signals).
In addition,many focus on identifying points where multiple entry reasons overlap.There are also many that explore the method for identifying ascent or decline targets using the three-line RCI.
In the explanations within the PDF files,
over 1,350 chartsare used.

× ![]()


