

[Win with mBDSR (RCI2 Full Filter)!] Common chart patterns
=================
【Free Indicator Information】
Display of RCI with BB, arrows signaling when the BB upper bound is broken upward or the lower bound is broken downward, display of RCI (10 or 12 candles)
https://www.gogojungle.co.jp/finance/navi/articles/70736
=================
【Master RCI!! Trend Reversal, Buy on Dips, Sell on Rallies】
Indicators that synergize with RCI for power【BODSOR・mBDSR】
and techniques, case studies (PDF) ★GogoJungle AWARD2020 winner★
https://www.gogojungle.co.jp/tools/indicators/11836
The PDF file includes 358 documents (over 1,400 pages, over 470,000 characters).
【Special Video vol.01 / Blacksun】
【Free e-book】Offers from 海O Hedge Fund?! One of Japan’s leading RCI researchers’ trading history
https://www.gogojungle.co.jp/finance/navi/articles/89634
【Special Video vol.02 / Blacksun】
【Final Edition | The Essentials of RCI Analysis】Thorough explanation of multi-time-frame and technical methods to boost win rate
https://www.gogojungle.co.jp/finance/navi/articles/89635
【Special Video vol.03 / Blacksun】
【Reasons for surpassing 400 users】Raise trading advantage with MT5 version multi-time analysis
https://www.gogojungle.co.jp/finance/navi/articles/89636
GBPUSD 30-minute Chart with mBDSR (RCI 2-line filter) Signals
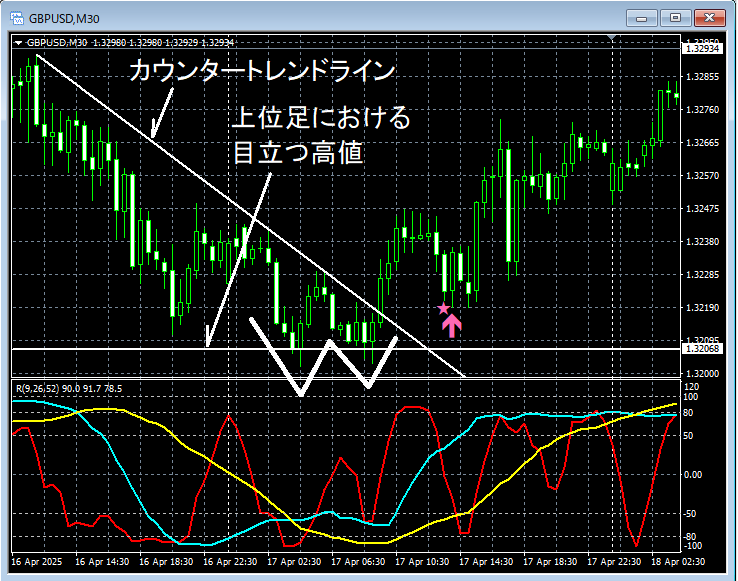
Looking at the 30-minute above,visible highs on higher timeframescannot be broken and are repelled.Breakout of the counter-trend lineand rising.Formation of a double bottomFollowing the decline,the mBDSR (RCI 2-line filter) dip-buy signallights up and price moves higher.
From this example,a trading method focusing on notable highs, counter-trend lines, and double bottomsandthe signal of mBDSRshow a high degree of compatibility.
Note: In this article's charts, for readability, circles, lines, and rectangles may be added.
Indicators that synergize with RCI for power【BODSOR・mBDSR】
and methods, case studies (PDF) ★GogoJungle AWARD2020 winner★
https://www.gogojungle.co.jp/tools/indicators/11836
The PDF file includes 358 documents (over 1,400 pages, over 470,000 characters).
Many of them arecompiled to logically link higher and lower timeframes using 3-line RCI, and then to sequentially consider the conditions of several lower timeframes, ultimately waiting for the timing of dip-buying or sell-reversals on the lower timeframes (i.e., the mBDSR signal).
Additionally,there are many works focusing on identifying points where multiple entry premises overlap.
Furthermore,there are methods to explore upside targets and downside targets using three-line RCI.
In the PDF explanations,more than 1,350 chartsare used.
× ![]()


