

After a pullback sell signal lights up on the 1-hour chart, also on the 5-minute chart (USDCAD) [RCI three lines + mBDSR]
※Campaign is ongoing until January 10, 2019.
The sales page for BODSOR (mBDSR) ishere.
BODSOR is an indicator developed to improve the entry accuracy when buying on dips or selling on rallies using the RCI 3-line.
It is an indicator developed to enhance the entry accuracy when buying on dips or selling on rallies using the RCI 3-line.
This time, the bonus indicator 【mBDSR】 has been bundled with 【BODSOR】.
【mBDSR】 (Bonus indicator):
The development concept is the same as【BODSOR】, but the arrow signal generation conditions and its calculation method are completely different.
Since more arrow signals occur than with 【BODSOR】, it increases the likelihood of capturing entry opportunities that could not be captured with 【BODSOR】.
First, here is the USDCAD 1-hour chart.
USDCAD 1-hour

Top row:mBDSR
Among the three RCI lines, only RCI9 is clearly rising.
If RCI9 reverses and declines, there is a possibility that all three RCIs will decline.
In other words, the price may also fall strongly.
In such a situation,mBDSR return-selling signal (yellow arrow circled) lights up.
The signal lit up at 10:00 MT4 server time (5:00 PM Japan time) on December 19.
After that, the price has been falling steadily.
Looking at the 5-minute chart after a signal lights up on the 1-hour chart...
USDCAD 5-minute
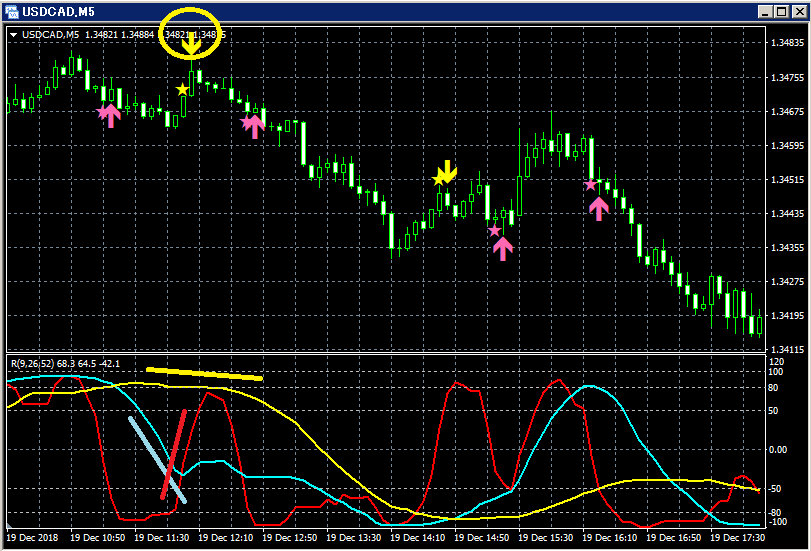
Top row:mBDSR
Bottom row: RCI 3-line (red: RCI9, light blue: RCI26, yellow: RCI52)
Among the three RCI lines, only RCI9 is clearly rising.
If RCI9 reverses and declines, there is a possibility that all three RCIs will decline.
In other words, the price may fall strongly.
In such a situation,mBDSR return-selling signal (yellow arrow circled) lights up.
The signal lit up at 12:05 MT4 server time (7:05 PM Japan time) on December 19.
After that, the price has been falling steadily.
The sales page for BODSOR (mBDSR) ishere.

Twitter
https://twitter.com/RCIX3Line
Blog
http://bodsor.blog.fc2.com/
Investment Navi+
https://fx-on.com/navi/serial/?id=359
YouTube
https://www.youtube.com/channel/UCL-g5uAlesiWVJEDtWlFvGw
USD/JPY 1-hour chart example of dip-buying and pullback-selling signals
※In the charts in this article, for convenience, there may be added marks such as circles, lines, and rectangles, so please understand.
ご了承ください。


