

[mBDSR (RCI2 Full Filter) Win!!] Look for signs of a pullback near important support level
【Master RCI to Win Maximally!! Trend Reversal, Buy the Dip, Sell the Rally】
Indicator that shines in combination with RCI【BODSOR・mBDSR】
and techniques / case studies (PDF) ★GogoJungle AWARD2020 Winner★
https://www.gogojungle.co.jp/tools/indicators/11836
The PDF file includes 358 items (over 1,400 pages, over 470,000 characters in total).
【Special Video vol.01 / Blacksun】
【Free e-book】Even offers from overseas hedge funds!? One of Japan’s top RCI researchers’ trading history
https://www.gogojungle.co.jp/finance/navi/articles/89634
【Special Video vol.02 / Blacksun】
【The Definitive Guide|The Essence of RCI Analysis】Thorough explanation of multi-timeframe and technical methods to improve win rate
https://www.gogojungle.co.jp/finance/navi/articles/89635
【Special Video vol.03 / Blacksun】
【Reason for surpassing 400 users】Raise trading edge with MT5 version multi-timeframe analysis
https://www.gogojungle.co.jp/finance/navi/articles/89636
Euro/Aud EURAUD 5-minute chart
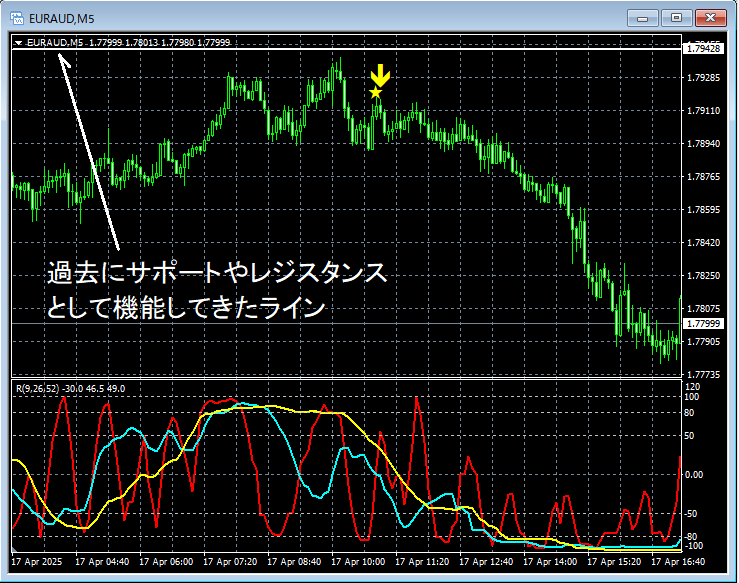
Looking at the 5-minute chart abovea line that has historically functioned as support and resistanceis seeing a pullback nearby. After that,the mBDSR (RCI with 2 lines) sell signallights up and price moves down.
From this example,a trading method that focuses on pullbacks at key horizontal levelsandthe compatibility with mBDSR signalsis evident.
※Please note that in this article the charts may include added circles, lines, and rectangles for explanatory convenience.
Indicator that shines in combination with RCI【BODSOR・mBDSR】
and techniques / case studies (PDF) ★GogoJungle AWARD2020 Winner★
https://www.gogojungle.co.jp/tools/indicators/11836
The PDF file includes 358 items (over 1,400 pages, over 470,000 characters in total).
Many of these areexamples that use three RCI lines to logically link higher and lower timeframes, sequentially analyze multiple lower timeframes, and ultimately wait for dip buy or pullback sell timing (i.e., mBDSR signals) on the lower timeframe.
Additionally,many emphasize identifying points where multiple entry justifications overlap.
Furthermore,there are methods that explore upside and downside targets using three-line RCIas well.
In the PDF explanations,over 1,350 chartsare used.
× ![]()


