

[Master RCI to Ultimate Victory!!] Double top and neckline break and mBDSR pullback selling signal
【Master RCI to Win Highly!! Trend Reversal, Buy Dips, Sell Rallies】
An indicator that shines in combination with RCI【BODSOR・mBDSR】
and its methods & case studies (PDF) ★GogoJungle AWARD2020 Winner★
https://www.gogojungle.co.jp/tools/indicators/11836
The PDF file includes 358 items (over 1,400 pages, over 470,000 characters).
At the beginning of this year, the MT5 version beta was released!!
mBDSR (Product ID 11836) Purchase Bonus】MT5 version indicator (Beta)
“mBDSR (no filter, RCI filter, MA filter)”
https://www.gogojungle.co.jp/tools/indicators/56765
To help you make more effective use of the MT5 version of mBDSR, we added 88 more PDFs (over 330 pages, more than 320 chart sheets, over 120,000 characters).
Gold XAUUSD 15-minute chart
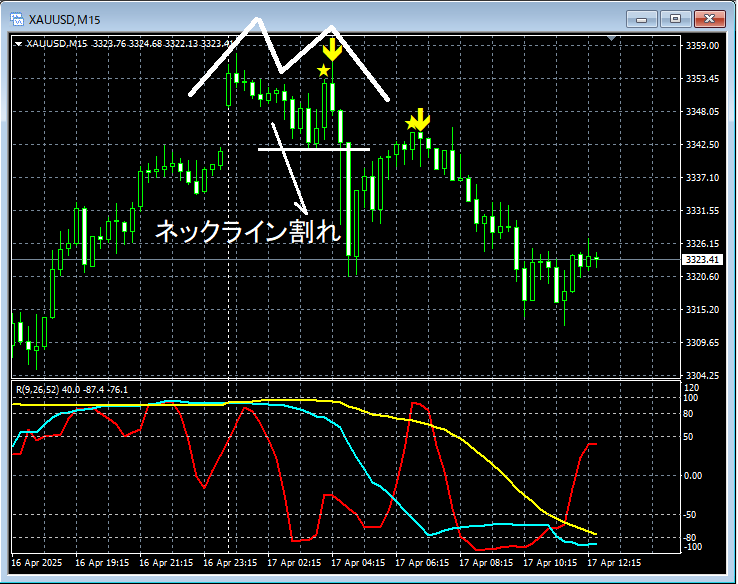
The higher time-frame context is omitted. On the 15-minute chart above, first, a potentialDouble Topon the right-hand peakmBDSR (RCI two-filter) sell signallights up and the price moves downward. Then,Break of neck lineis followed by a rise, triggering againmBDSR (RCI two-filter) sell signallights up and the price moves downward.
From this example,a trading method focused on the Double Topandthe harmony with mBDSR signalsis evident.
※ Please note that in the charts introduced in this article, for convenience of explanation, circles, lines, and rectangles may be drawn.
An indicator that shines in combination with RCI【BODSOR・mBDSR】
and its methods & case studies (PDF) ★GogoJungle AWARD2020 Winner★
https://www.gogojungle.co.jp/tools/indicators/11836
The PDF file includes 358 items (over 1,400 pages, over 470,000 characters).
Many of these are about using three RCI lines to logically link higher and lower time frames, sequentially considering the conditions of multiple lower time frames, and ultimately waiting for buy dips or sell rallies on the lower time frames (i.e., mBDSR signals).
In addition,many of them emphasize identifying points where multiple entry reasons overlap.There are also many examples focusing on this.
Also included is a method that explores upward and downward targets using the three-RCI-line approach.
In the explanations within the PDF file,over 1,350 chartsare used.

× ![]()


