

Pattern of lowering from the RCI3 double top to the triple bottom [RCI3 three-line pattern + mBDSR] USDJPY 1-minute chart example
※Campaign ongoing until January 10, 2019.
The sales page for BODSOR (mBDSR) is here.
BODSOR is an indicator developed to improve entry accuracy when using three-line RCI3 for breakout buying and pullback selling.
This time, the bonus indicator 【mBDSR】 is included with 【BODSOR】.
【mBDSR】(bonus indicator):
The development concept is the same as for 【BODSOR】, but the arrow signal conditions and their calculation method are completely
different.
Since more arrow signals occur with 【mBDSR】, there is a higher possibility of capturing entry opportunities that could not be captured with 【BODSOR】.
The figure below is a 1-minute chart of USD/JPY.
USD/JPY 1-minute chart (December 18, 2018)
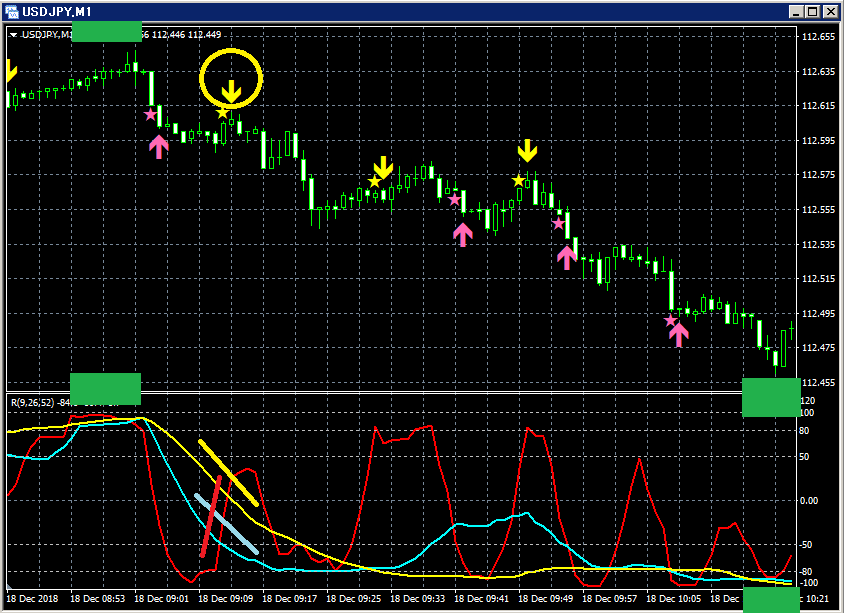
Top row: mBDSR
Among the three RCI lines, only RCI9 is clearly rising.
If RCI9 reverses downward, there is a possibility that all three RCI lines will turn downward.
In other words, the price could make a strong decline.
In such a scenario, the mBDSR return/sell signal (yellow arrows circled in a circle) lights up,
This is a very common pattern where after a so-called "RCI three-top," the short-term line RCI9 dips and then rises again to target a retracement.
BODSOR (mBDSR) sales page is here.

Twitter
https://twitter.com/RCIX3Line
Blog
http://bodsor.blog.fc2.com/
Investment Navi+
https://fx-on.com/navi/serial/?id=359
YouTube
https://www.youtube.com/channel/UCL-g5uAlesiWVJEDtWlFvGw
Example of buy on dips and sell on rallies signals for USD/JPY on the 1-hour chart
※Note: In the charts within this article, for convenience, there may be added circles, lines or rectangles representing features such as currency units; please understand this.


