

【Master RCI!!】Seek signs of rebound near the moving average we prioritize (2)
【Master RCI to Win Big!! Trend Reversal, Buy on Dips, Sell on Rallies】
Indicator that shines in combination with RCI: 【BODSOR・mBDSR】
and method, case studies (PDF) ★GogoJungle AWARD2020 Winner★
https://www.gogojungle.co.jp/tools/indicators/11836
The PDF files include 358 items (over 1,400 pages, over 470,000 characters in total).
At the beginning of this year, the MT5 version Beta was released!!
mBDSR (Product ID 11836) Purchase Bonus】MT5 Version Indicator (Beta)
“mBDSR (no filter, RCI filter, MA filter)”
https://www.gogojungle.co.jp/tools/indicators/56765
To make fuller use of the MT5 version of mBDSR, 88 more PDFs have been added (over 330 pages in total, more than 320 chart images, over 120,000 characters).
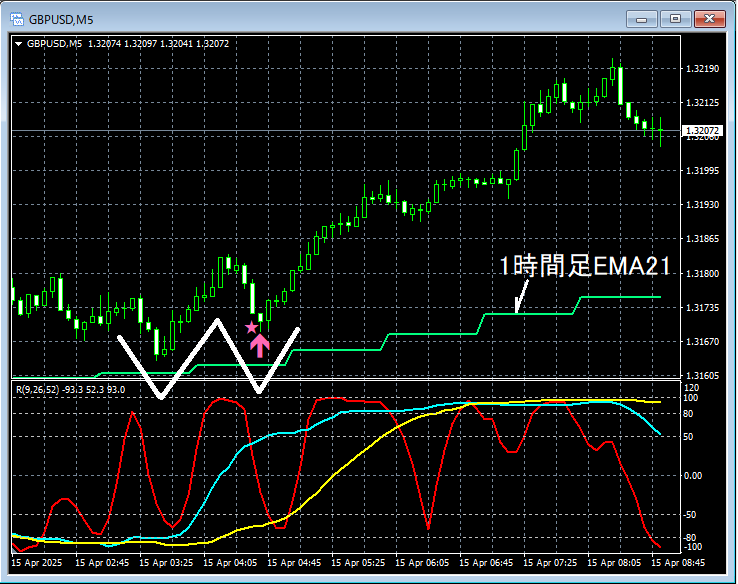
Pound-Dollar GBPUSD 5-minute chart
Details on higher timeframes are omitted. Also,Drawdown from higher to lower timeframes using RCIis explained in detail in the included PDF, so it is also omitted here. It is not a random glance at the 5-minute chart.
In actual trading, when formulating a plan,understanding higher-timeframe conditionsanddrawdown from higher to lower timeframes using RCIare extremely important.
Looking at the 5-minute chart above, what is emphasized in this case isthe nearby 1-hour EMA21rebounding somewhat. After that,the buy-on-dip signal of mBDSR (RCI with two filters)lights up and the price rises sharply.
From this example,a trading method focusing on rebounds at moving averages and the three-line RCIandthe harmony with mBDSR signalsis evident.
Also, in this example, placing the stop loss slightly below the recent lownear-term lowallows for a favorable risk-reward trade.
※Charts referenced in this article may include added circles, lines, or rectangles for explanatory convenience, please understand.
Indicator that shines in combination with RCI【BODSOR・mBDSR】
and method, case studies (PDF) ★GogoJungle AWARD2020 Winner★
https://www.gogojungle.co.jp/tools/indicators/11836
The PDF files include 358 items (over 1,400 pages, over 470,000 characters in total).
Most of them are examples that have been distilled to logically link higher and lower timeframes using three-line RCI, sequentially examine the status of multiple lower timeframes, and ultimately wait for buy-on-dip or sell-on-rally timing (the mBDSR signal) on the lower timeframe.They also include many that emphasize overlapping entry rationale.
Additionally,there are many that explore targets for rising or falling using three-line RCI.
over 1,350 chartsIn the PDF explanations,
are used.
× ![]()


