【Master RCI to Win!!】PDF collection for 1-minute short-term trading (scalping)
【Master RCI to the utmost!! Trend reversal, pullback buying, range selling】
Indicator 【BODSOR・mBDSR】 that shines when combined with RCI
Methods and Case Studies (PDF) ★GogoJungle AWARD2020 winner★
https://www.gogojungle.co.jp/tools/indicators/11836
※This product comes with 358 PDFs (over 1,400 pages, over 1,350 chart sheets, over 470,000 characters) as its methods and case studies.
※Recently, in addition to the above PDFs, an attached PDF for 1-minute short-term trading (scalping) methods and case studies has been added.
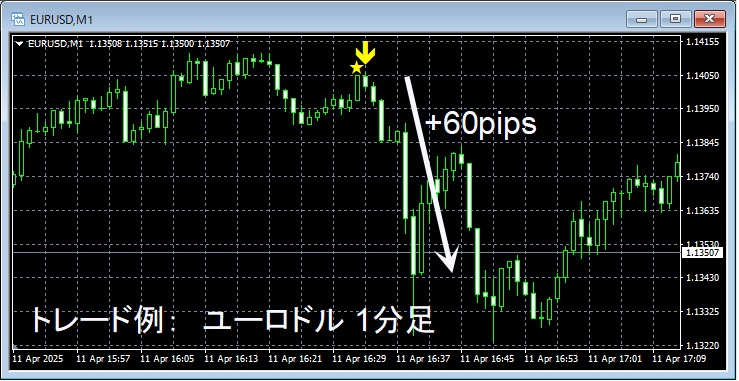
As of September 18, 2026, the file names and titles of the PDFs added for 1-minute short-term trading are as follows.
(1) mBDSRhint_M1_1_20250401.pdf
Example of short-term rebound handling from the 5-minute RCI9 bottom zone (also note the previous low on the higher timeframe)
(2) mBDSRhint_M1_2_20250401.pdf
Example of short-term rebound handling from a 5-minute double bottom (also note the higher timeframe)
(3) mBDSRhint_M1_3_20250401.pdf
Example of short-term rebound handling from a 5-minute triple bottom (also note notable highs on the higher timeframe)
(4) mBDSRhint_M1_4_20250403.pdf
Return selling and take-profit targets after support/resistance turn
(5) mBDSRhint_M1_5_20250407.pdf
Return selling on the 1-minute chart without opposing the trend on higher timeframes
(6) mBDSRhint_M1_6_20250408.pdf
Short-term decline handling from a 5-minute RCI3 top
(7) mBDSRhint_M1_7_20250412.pdf
Short-term rebound handling from a 5-minute RCI2 double bottom (also note the previous low on the higher timeframe)
(8) mBDSRhint_M1_8_20250412.pdf
Short-term rebound handling from a 5-minute RCI9 bottom zone (also note the pin bars on the higher timeframe)
(9) mBDSRhint_M1_9_20250412.pdf
Short-term upside handling when the 30-minute chart shows a strong pattern
(10) mBDSRhint_M1_10_20250412.pdf
1-minute rebound selling when the 5-minute chart shows a weak pattern
(11) mBDSRhint_M1_11_20250413.pdf
Return selling after breaking the pushing low, with Fibonacci emphasis
(12) mBDSRhint_M1_12_20250413.pdf
Short-term rebound handling from a 5-minute triple bottom (note higher timeframe rebound highs and Fibonacci)
(13) mBDSRhint_M1_13_20250413.pdf
Short-term decline handling from a 5-minute RCI2 top (watch round numbers)
(14) mBDSRhint_M1_14_20250413.pdf
Consider rebound selling on the 1-minute chart by watching the higher timeframe trend
(15) mBDSRhint_M1_15_20250413.pdf
Short-term rebound handling from a 5-minute RCI2 double bottom (focus on resistance-turned-support)
(16) mBDSRhint_M1_16_20250703V1.pdf
Short-term decline handling from a 5-minute RCI9 top zone (watch gap filling)
(17) mBDSRhint_M1_17_20250414.pdf
If the 5-minute chart is weak, consider rebound selling on the 1-minute chart
(18) mBDSRhint_M1_18_20250414.pdf
If the 5-minute chart is strong, consider pullback buying on the 1-minute chart (also note higher timeframes)
(19) mBDSRhint_M1_19_20250414.pdf
If the 15-minute chart is weak, consider rebound selling on the 1-minute chart
(20) mBDSRhint_M1_20_20250414.pdf
Trade the pullback buying on the 1-minute chart without fighting the higher timeframe trend
(21) mBDSRhint_M1_21_20250414.pdf
If the 5-minute chart is weak, rebound selling on the 1-minute chart with attention to trendlines
(22) mBDSRhint_M1_22_20250415.pdf
Short-term decline handling from a 5-minute RCI9 top zone (watch higher timeframe rebound signals)
(23) mBDSRhint_M1_23_20250415.pdf
Short-term rebound handling from a 5-minute triple bottom (also note pin bars)
(24) mBDSRhint_M1_24_20250415.pdf
Short-term rebound handling near important moving averages (Gold)
(25) mBDSRhint_M1_25_20250417V1.pdf
Short-term rebound handling near the support zone
(26) mBDSRhint_M1_26_20250415.pdf
Drawdown handling from near the resistance-highs (note the double top)
(27) mBDSRhint_M1_27_20250415.pdf
If the 5-minute chart is strong, use the 1-minute chart for pullback buying
(28) mBDSRhint_M1_28_20250416.pdf
Return selling from support on higher timeframes on the 1-minute chart
(29) mBDSRhint_M1_29_20250415.pdf
Drawdown handling from noticeable lows on the higher timeframe
(30) mBDSRhint_M1_30_20250416.pdf
Return selling in notable lows on the 5-minute chart vicinity
(31) mBDSRhint_M1_31_20250416.pdf
Short-term upside handling from a 30-minute RCI2 bottom with target initials
(32) mBDSRhint_M1_32_20250417.pdf
Short-term rebound handling near notable highs on the higher timeframe (Nikkei 225) (1)
(33) mBDSRhint_M1_33_20250417.pdf
Short-term rebound handling near notable highs on the higher timeframe (Nikkei 225) (2)
(34) mBDSRhint_M1_34_20250417.pdf
Short-term rebound selling (watch higher timeframe pin bars)
(35) mBDSRhint_M1_35_20250417.pdf
Drawdown handling from the previous high on the higher timeframe
(36) mBDSRhint_M1_36_20250417.pdf
If the higher timeframe shows strength, 1-minute pullback buying consideration
(37) mBDSRhint_M1_37_20250418.pdf
If the 5-minute chart is weak, consider rebound selling on the 1-minute chart (also note double tops)
(38) mBDSRhint_M1_38_20250419V1.pdf
If the 5-minute chart is weak, consider rebound selling on the 1-minute chart
(39) mBDSRhint_M1_39_20250418.pdf
Short-term decline handling from a 5-minute RCI2 double top (also note counter-trend lines)
(40) mBDSRhint_M1_40_20250418.pdf
Short-term rebound handling from a 1-hour RCI2 bottom
(41) mBDSRhint_M1_41_20250418.pdf
Short-term rebound handling from a 5-minute RCI3 bottom (also note double bottoms)
(42) mBDSRhint_M1_42_20250418.pdf
Return buying handling from a pin bar appearing on higher timeframes
(43) mBDSRhint_M1_43_20250419.pdf
Short-term rebound handling from a 30-minute RCI9 bottom zone
(44) mBDSRhint_M1_44_20250419.pdf
Short-term decline handling from a 5-minute RCI2 double top (watch Fibonacci and pushing support breaks)
(45) mBDSRhint_M1_45_20250420.pdf
Short-term rebound handling from near the higher timeframe resistance turned support
(46) mBDSRhint_M1_46_20250423.pdf
Short-term decline handling near the resistance zone
(47) mBDSRhint_M1_47_20250423.pdf
Rebound handling near the moving averages that are considered important
(48) mBDSRhint_M1_48_20250423.pdf
When the 5-minute chart is weak, rebound selling on the 1-minute chart (includes rebound selling guidance)
(49) mBDSRhint_M1_49_20250429.pdf
Short-term rebound handling at the lower boundary of the downtrend channel
(50) mBDSRhint_M1_50_20250501.pdf
When the 5-minute chart is strong, rebound buying on the 1-minute chart (Bank of Japan rate decision)
(51) mBDSRhint_M1_51_20250504.pdf
When the 5-minute chart is strong, rebound buying on the 1-minute chart
(52) mBDSRhint_M1_52_20250504.pdf
When the 15-minute chart is weak, consider rebound selling on the 1-minute chart
(53) mBDSRhint_M1_53_20250516.pdf
When the 5-minute chart is weak, rebound selling with MA filter (pattern 1)
(54) mBDSRhint_M1_54_20250516.pdf
When the 5-minute chart is strong, pullback buying with MA filter (pattern 1)
(55) mBDSRhint_M1_55_20250517.pdf
When the 5-minute chart is weak, rebound selling with MA filter (pattern 2)
(56) mBDSRhint_M1_56_20250516.pdf
When the 5-minute chart is strong, pullback buying with MA filter (pattern 2)
(57) mBDSRhint_M1_57_20250516.pdf
When the 5-minute chart is strong, pullback buying with MA filter (pattern 3)
(58) mBDSRhint_M1_58_20250517.pdf
When the 5-minute chart is weak, rebound selling with MA filter (pattern 3)
(59) mBDSRhint_M1_59_20250612.pdf
Short-term downside handling when the 30-minute RCI9 is at the top zone (using mBDSR with R1R2S2)
(60) mBDSRhint_M1_60_20250620.pdf
When the 5-minute chart is weak, rebound selling on the 1-minute chart
(61) mBDSRhint_M1_61_20250626.pdf
Return selling from a pin bar on the higher timeframe using R1R2S2
(62) mBDSRhint_M1_62_20250701.pdf
Return selling on the 1-minute chart when the 30-minute chart is weak (consider profit targets)
(63) mBDSRhint_M1_63_20250630.pdf
Short-term rebound handling from the 30-minute Bottom RCI9 (focus on notable highs in the past)
(64) mBDSRhint_M1_64_20250630.pdf
When the 5-minute chart is strong, consider pullback buying with MA filter (pattern 4)
(65) mBDSRhint_M1_65_20250630.pdf
Discuss rebound selling on the lower timeframe from near the higher timeframe pullback area
(66) mBDSRhint_M1_66_20250701.pdf
When the 5-minute chart is strong, pullback buying with MA filter (pattern 5)
(67) mBDSRhint_M1_67_20250701.pdf
When the 5-minute chart is weak, rebound selling with MA filter (pattern 4)
(68) mBDSRhint_M1_68_20250701.pdf
When the 5-minute chart is weak, rebound selling with MA filter (pattern 5)
(69) mBDSRhint_M1_69_20250702.pdf
Short-term rebound handling from the 5-minute RCI9 bottom zone (use the Sakata five methods: dawn star, R1R2S2)
(70) mBDSRhint_M1_70_20250701.pdf
When the lower timeframe shows rebound selling, how to handle it on the lower timeframe
(71) mBDSRhint_M1_71_20250703.pdf
Return selling handling on the lower timeframe when the 5-minute chart is weak
(72) mBDSRhint_M1_72_20250703.pdf
Short-term decline handling from a 5-minute RCI9 top zone (note notable highs in the past)
(73) mBDSRhint_M1_73_20250704.pdf
Pullback buying consideration when the 5-minute chart is strong (US non-farm payrolls - 1)
(74) mBDSRhint_M1_74_20250704.pdf
Pullback buying consideration when the 5-minute chart is strong (US non-farm payrolls - 2)
(75) mBDSRhint_M1_75_20250705.pdf
Return selling consideration on the lower timeframe after a return-sell signal on the higher timeframe
(76) mBDSRhint_M1_76_20260916.pdf
Gold scalping(1)
If the 5-minute chart is strong, use R1R2S2 on the 1-minute chart for pullback buying
(77) mBDSRhint_M1_77_20260917.pdf
Gold scalping(2)
If the 5-minute chart is weak, return selling on the 1-minute chart
(78) mBDSRhint_M1_78_20260917.pdf
Gold scalping(3)
Post-FOMC handling
(79) mBDSRhint_M1_79_20260917.pdf
Gold scalping(4)
If the 5-minute chart is strong, 1-minute pullback buying handling
(80) mBDSRhint_M1_80_20260917.pdf
Gold scalping(5)
Downside handling from the 5-minute RCI3 top
(81) mBDSRhint_M1_81_20260917.pdf
Gold scalping(6)
Short-term rebound handling near important moving averages
Indicator that shines when combined with RCI 【BODSOR・mBDSR】
Methods and Case Studies (PDF) ★GogoJungle AWARD2020 winner★
https://www.gogojungle.co.jp/tools/indicators/11836
The PDF files number 358 (over 1,400 pages, over 470,000 characters) are included.
Many of them are structured to logically link higher and lower timeframes using three RCI lines, gradually analyzing multiple lower timeframes, and ultimately waiting for entries on the lower timeframe such as pullback buying or rebound selling signals of the mBDSR.They also place emphasis on catching points where multiple entry reasons overlap.
Furthermore, the material includes methods that explore potential upside and downside targets using three RCI lines.
In the PDF explanations,over 1,350 chartsare used.