

Nikkei 225 JP225 【Master RCI to win exceptionally!!】 Rebound near the previous low and mBDSR pullback buying signal
0
【Master RCI to Win at All Costs!! Trend Reversal, Buy on Dips, Sell on Rallies】
Indicator【BODSOR・mBDSR】that showcases power when combined with RCI
and methods・case studies (PDF) ★GogoJungle AWARD2020 winner★
https://www.gogojungle.co.jp/tools/indicators/11836
The PDF file includes 358 items (over 1,400 pages, over 470,000 characters in total).
At the beginning of this year, the MT5 version Beta was released!!
mBDSR (Product ID 11836) Purchase Bonus】MT5 Version Indicator (Beta)
“mBDSR (no filter, RCI filter, MA filter)”
https://www.gogojungle.co.jp/tools/indicators/56765
To help you make even better use of the MT5 version of mBDSR, we have added 77 more PDFs (over 280 pages in total, over 270 charts, over 100,000 characters).
Nikkei 225 JP225 4-hour chart
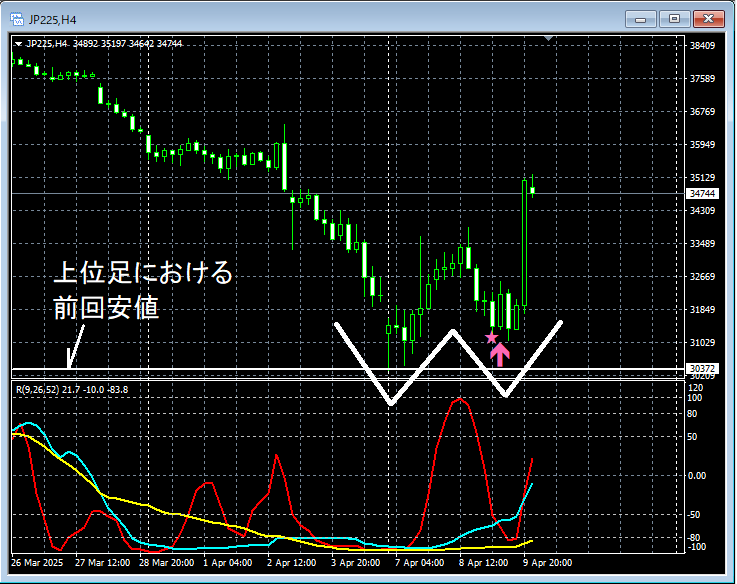
On the above 4-hour chart, higher timeframe showsprevious lowapproaching, forming the so-calledRCI triple bottom. After that, it forms adouble bottomand rises. Thedouble bottombeginning of the rise on the right-side valleymBDSR (RCI two-filter) dip-buy signalcaptures the timing well.
From this example,the trading approach focusing on the RCI three-line, and the Double Bottomandsignals from mBDSRshow high compatibility.
※Please note that for convenience, the charts in this article may include added circles, straight lines, or rectangles.
Indicator that shines when combined with RCI【BODSOR・mBDSR】
and methods・case studies (PDF) ★GogoJungle AWARD2020 winner★
https://www.gogojungle.co.jp/tools/indicators/11836
The PDF file includes 358 items (over 1,400 pages, over 470,000 characters in total).
Many of them are about assessing multiple lower timeframes sequentially by logically linking higher and lower timeframes using the three-line RCI, and ultimately waiting for dip-buy or rally-sell timing (i.e., mBDSR signals) on the lower timeframes.
Also,many emphasize pinpointing common entry justification points.
Additionally,there are methods for exploring ascent targets and decline targets using the RCI three-lineas well.
In the PDF explanations,more than 1,350 chartsare used.

× ![]()


