

Trend reversal seen from the sign of "RCI3 triple line + mBDSR" (USD/JPY)
※Campaign ongoing until January 10, 2019.
The sales page for BODSOR (mBDSR) ishere.
BODSOR is an indicator developed to improve entry accuracy when buying on dips or selling on rallies using three RCI lines.
to enhance accuracy.
This time, a bonus indicator【mBDSR】 is included with 【BODSOR】.
【mBDSR】 (bonus indicator):
The development concept is the same as for 【BODSOR】, but the conditions for generating arrow signs and their calculation method are completely different.
Compared to 【BODSOR】, more arrow signs are generated, increasing the likelihood of catching entry opportunities that could not be captured with 【BODSOR】.
The diagram below is a 2-hour chart of USD/JPY.
USD/JPY 2-hour chart (December 10–18, 2018)
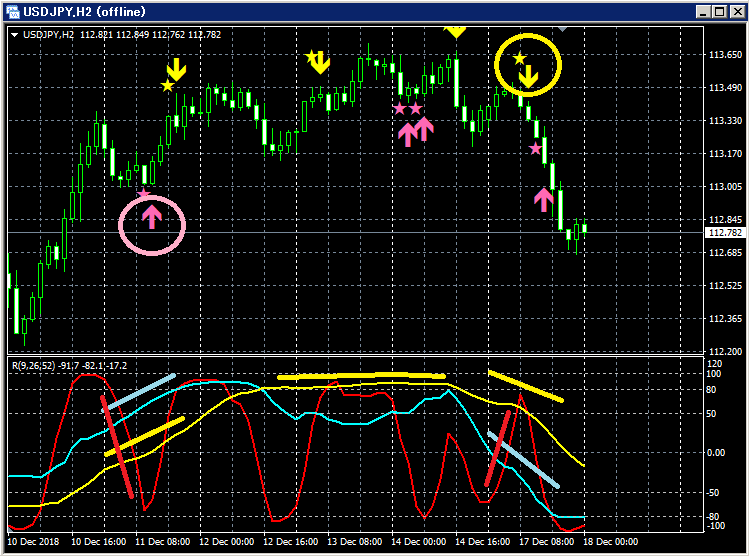
Top row:mBDSR
Bottom row: RCI three-line indicators (Red: RCI9, Light blue: RCI26, Yellow: RCI52)
(1) Buy-on-dip signal
Among the three RCI lines, only RCI9 is clearly declining.
If RCI9 reverses upward, all three RCI lines may rise together.
In other words, the price may rise strongly.
In such a scenario,mBDSR’s buy-on-dip signal (pink arrow circled) lights up.
There have been three consecutive bullish candles immediately after the signal,
You can see that.and it continues to rise smoothly.
(2) RCI52 rises to the ceiling
RCI52 rises to the upper zone and then turns down.
(3) Sell-on-rally signal
Among the three RCI lines, only RCI9 is clearly rising.
If RCI9 reverses downward, all three RCI lines may decline together.
In other words, the price may fall sharply.
In such a scenario,mBDSR’s sell-on-rally signal (yellow arrow circled) lights up.
There have been six consecutive bearish candles immediately after the signal, indicating a steady decline.

Twitter
https://twitter.com/RCIX3Line
Blog
http://bodsor.blog.fc2.com/
Invest Navi+
https://fx-on.com/navi/serial/?id=359
YouTube
https://www.youtube.com/channel/UCL-g5uAlesiWVJEDtWlFvGw
Example of buy-on-dip and sell-on-rally signals on the USD/JPY 1-hour chart
※Note: In this article's charts, for convenience of explanation, circles, lines, and squares may be drawn.
Please understand.
× ![]()


