

【Master RCI to Win!!】Counter-trend line and break of minor support, and mBDSR rebound selling signal
【Mastering RCI!! Trend Reversal, Buy Dips, Sell Rallies】
Indicator 【BODSOR・mBDSR】 that shines when combined with RCI
and techniques, case studies (PDF) ★GogoJungle AWARD2020 Winner★
https://www.gogojungle.co.jp/tools/indicators/11836
The PDF file includes 358 items (over 1,400 pages, over 470,000 characters total).
Earlier this year, the MT5 version Beta was released!!
mBDSR (Product ID 11836) Purchase Bonus】 MT5 Version Indicator (Beta)
“mBDSR (no filter, RCI filter, MA filter)”
https://www.gogojungle.co.jp/tools/indicators/56765
To help you make even better use of the MT5 version of mBDSR, an additional 77 PDFs (over 280 pages, over 270 chart sheets, over 100,000 characters) have been added.
In MT5, the 3-minute chart is available by default as follows.
USDJPY – 3-minute chart
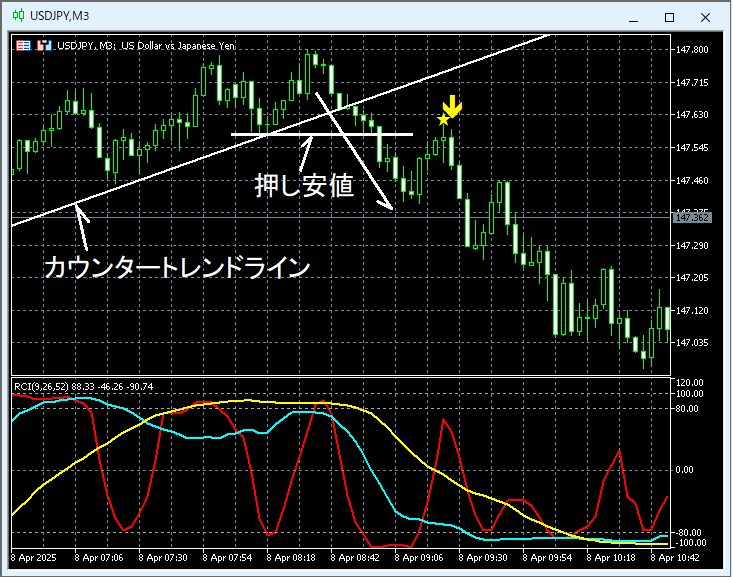
The status of the higher timeframe is omitted. On the upper 3-minute chart,price breaks below the counter-trend lineandlow of its pullback brokenfollowed by a risemBDSR (2 RCI filters) sell signallights up and price declines firmly.
Break of the pullback lowtemporarily negates the uptrend, andbreach of the downtrend linecan lead to a downward reversal, so this has more confluence of selling signals than merely a sell signal.
From this example,the trade method focusing on Dow Theory and counter-trend linesandthe signals of mBDSRshow strong compatibility.
※ Please note that the charts shown in this article may have added circles, straight lines, or rectangles for explanatory convenience.
Indicator 【BODSOR・mBDSR】 that shines when combined with RCI
and techniques, case studies (PDF) ★GogoJungle AWARD2020 Winner★
https://www.gogojungle.co.jp/tools/indicators/11836
The PDF file includes 358 items (over 1,400 pages, over 470,000 characters total).
Most of them are summaries of how to logically link higher and lower timeframes using the three RCI lines, sequentially examining multiple lower-timeframe conditions, and ultimately waiting for a dip-buy or pullback sell signal on the lower timeframe (i.e., the mBDSR signal).
In addition,many entries focus on catching points where multiple entry grounds coincide.There are also many cases that explore using three-RCI-line methods to gauge upward or downward targets.
Furthermore,the explanations in the PDF includeover 1,350 charts.

× ![]()


