

[Master RCI to the Extreme!!] Double top, counter-trend line, break of pullback lows, and mBDSR reversal signal to sell
【Master RCI to Win Absolutely!! Trend Reversal, Breakout Buy, and Pullback Sell】
Indicator【BODSOR・mBDSR】that delivers power when used with RCI
and methods・case studies (PDF) ★GogoJungle AWARD2020 winner★
https://www.gogojungle.co.jp/tools/indicators/11836
A PDF file with 358 items (over 1,400 pages, over 470,000 characters in total) is included.
Earlier this year, the MT5 version Beta was released!!
mBDSR (Product ID 11836) Purchase Bonus】 MT5 version indicator (Beta)
“mBDSR (no filter, RCI filter, MA filter)”
https://www.gogojungle.co.jp/tools/indicators/56765
To make better use of the MT5 version of mBDSR, an additional 88 PDFs (over 330 pages, over 320 chart images, over 120,000 characters) have been added.
Pound Dollar GBPUSD 5-minute chart
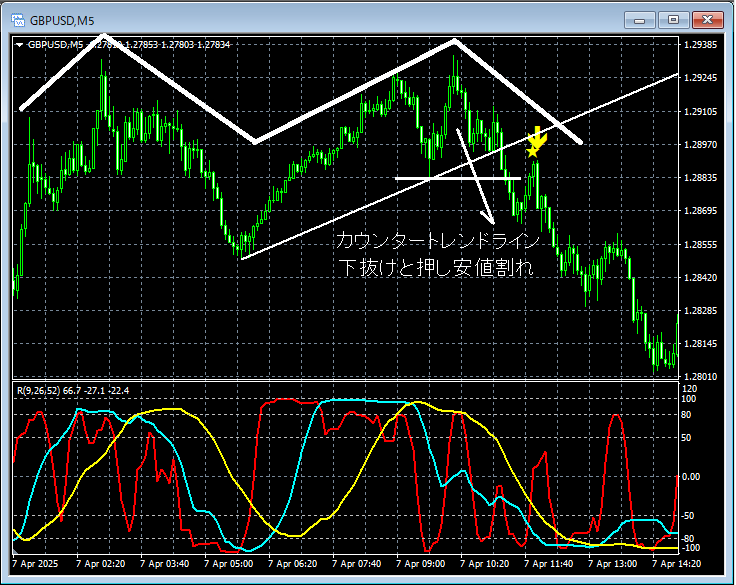
The upper-timeframe situation is omitted. On the 5-minute chart above, a potentialDouble Top declines from the right peak.Break below counter-trend line andBreak below the swing low followed by a risemBDSR (Two RCI filters) Sell signal lights up and price moves lower.
Break below swing low temporarily negates the uptrend,break below the downtrend line can lead to a downturn, so compared to just a sell signal lighting up, this means multiple sell reasons converge.
From this example,the trade method focusing on Double Top, Dow Theory, and counter-trend lineandthe signals of mBDSRshow high compatibility.
※Please note that charts referred to in this article may include added circles, lines, and rectangles for explanatory convenience.
Indicator【BODSOR・mBDSR】that delivers power when used with RCI
and methods・case studies (PDF) ★GogoJungle AWARD2020 winner★
https://www.gogojungle.co.jp/tools/indicators/11836
A PDF file with 358 items (over 1,400 pages, over 470,000 characters in total) is included.
Most of them document the form of logically linking higher and lower timeframes using the RCI three-line setup, sequentially considering the status of multiple lower timeframes, and ultimately waiting for pullback buys or pullback sells on the lower timeframe (i.e., mBDSR signals).
Also,many focus on identifying points where multiple entry reasons overlap..
Additionally,there are methods for exploring upside and downside targets using the RCI three-line setup..
In the PDF explanations,over 1,350 chartsare used.

× ![]()


