

[Master RCI!!] Downtrend line, pin bar and break of swing low, and mbDSR pullback sell signal
【Master RCI to Win Highly!! Trend Reversal, Buy Dips, Sell on Retracements】
Indicator【BODSOR・mBDSR】that powers up in combination with RCI
Methods・Case Studies (PDF) ★GogoJungle AWARD2020 Winner★
https://www.gogojungle.co.jp/tools/indicators/11836
The PDF file includes 358 items (over 1,400 pages in total, over 470,000 characters).
Early this year, the MT5 version Beta was released!!
mBDSR (Product ID 11836) Purchase Bonus】MT5 Version Indicator (Beta)
“mBDSR (No filter, RCI filter, MA filter)”
https://www.gogojungle.co.jp/tools/indicators/56765
To help you use the MT5 version of mBDSR more effectively, an additional 88 PDFs (over 330 pages in total, over 320 chart sheets, over 120,000 characters) have been added.
EURUSD 1-Hour
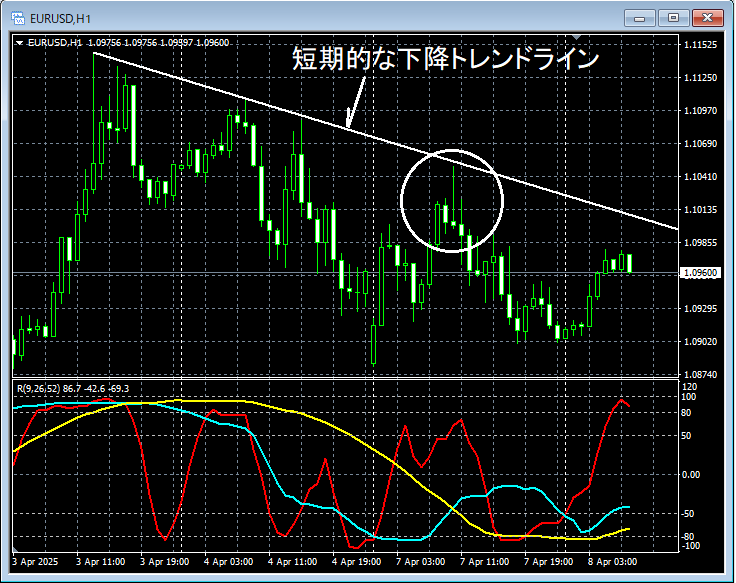
In the 1-hour chart above,a short-term downward trendlinerises near, then rebounds. At that time, a signal suggesting a downtrend reversal is lit upa long upper shadow pin baris illuminated.
EURUSD 5-Minute
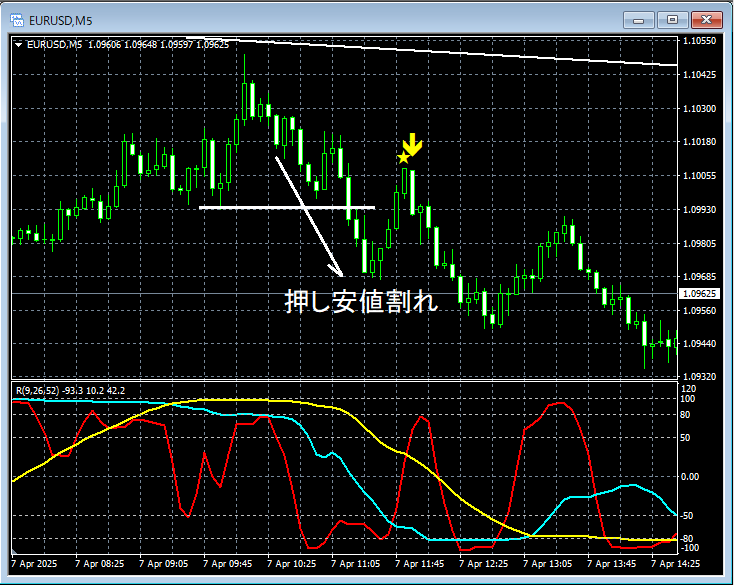
In the 5-minute chart above,a break of the swing lowis followed by a risemBDSR (two RCI filters) sell-back signallights up and prices move lower.
In addition to the short-term trendline and pin bars on the hourly chart, on the 5-minute chart thebreak of the swing lowonce again negates the upward trend; compared to a simple sell signal lighting up, multiple selling justifications are layered.
From this example,the high cohesion between trades based on higher-timeframe pin bars or declines from downward trendlines and the signals of mBDSRis evident.
※Please note that in some charts mentioned in this article, for convenience of explanation, circles, lines, and rectangles may have been added.
Indicator【BODSOR・mBDSR】that powers up in combination with RCI
Methods・Case Studies (PDF) ★GogoJungle AWARD2020 Winner★
https://www.gogojungle.co.jp/tools/indicators/11836
The PDF file includes 358 items (over 1,400 pages in total, over 470,000 characters).
Most of them area collection of examples that use three RCI lines to logically link higher and lower timeframes, sequentially considering the situations of multiple lower timeframes, ultimately waiting for a dip-buying or pullback selling timing (i.e., the signal of mBDSR) on the lower timeframes.
Also,many emphasize capturing points where multiple entry reasons overlap..
Additionally,there are methods that explore upside and downside targets using three lines of RCI..
In the descriptions within the PDF files,more than 1,350 chartsare used.

× ![]()


