

【Master RCI to win!!】Looking for signs of rebound near the moving average line we consider important (1)
【Master RCI to Win Big!! Trend Reversal, Buy on Dips, Sell on Rallies】
Indicator that shines in combination with RCI: 【BODSOR・mBDSR】
Methods and Case Studies (PDF) ★GogoJungle AWARD2020 winner★
https://www.gogojungle.co.jp/tools/indicators/11836
The PDF file contains 358 items (over 1,400 pages, over 470,000 characters in total).
Earlier this year, the MT5 version beta was released!!
mBDSR (Product ID 11836) Purchase Bonus】MT5 version indicator (Beta)
“mBDSR (no filter, RCI filter, MA filter)”
https://www.gogojungle.co.jp/tools/indicators/56765
To help you use the MT5 version of mBDSR more effectively, 88 more PDFs have been added (over 330 pages in total, over 320 chart sheets, over 120,000 characters).
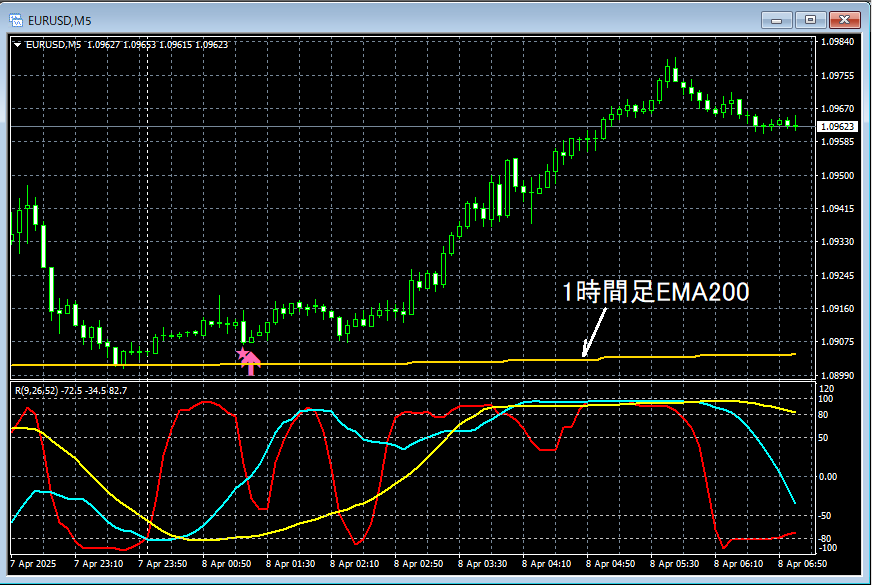
EURUSD 5-minute chart
Upper timeframe conditions are omitted. Also,Explanation of drilling down from higher timeframes to lower timeframes using RCIis provided in the accompanying PDF, so it is also omitted here. It is not simply looking at a 5-minute chart arbitrarily.
In actual trading, when planning a strategy,grasping the higher timeframe conditionsanddrilling down from higher to lower timeframes using RCIare extremely important.
Looking at the 5-minute chart above, what is considered important in this case isthe vicinity of the 1-hour EMA200as it tends to rebound. After that,the mBDSR (RCI two-filter) buy-the-dip signallights up and the price rises sharply.
From this example,the synergy between a breakout/rebound around moving averages and a trading method focused on the three RCI linesandthe signals of mBDSRis evident.
Also, in this example, placing the stop loss just below the recent lowenables a favorable risk/reward trade.
※Please note that the charts introduced in this article may include added circles, lines, or boxes for explanation convenience.
Indicator that shines in combination with RCI: 【BODSOR・mBDSR】
Methods and Case Studies (PDF) ★GogoJungle AWARD2020 winner★
https://www.gogojungle.co.jp/tools/indicators/11836
The PDF file contains 358 items (over 1,400 pages, over 470,000 characters in total).
Most of them are examples that logically link higher and lower timeframes by using three RCI lines, sequentially examine the status of multiple lower timeframes, and ultimately wait for the timing to buy on dips or sell on rallies on the lower timeframe (i.e., signals from mBDSR)..
In addition,many focus on identifying points where multiple entry reasons coincide..
Also included is a method to explore ascent or descent targets using three-line RCI.
In the PDF explanations,more than 1,350 chartsare used.
× ![]()


