

【RCI3 Single Line + mBDSR】 South Africa Rand Yen 4-hour Chart Retracement Sell Signal
※Campaign ongoing until January 10, 2019.
The sales page for BODSOR (mBDSR) is here.
BODSOR is an indicator developed to improve entry accuracy when using the three-line RCI to perform dip-buying or pullback-selling.
This time, a bonus indicator【mBDSR】 is included with 【BODSOR】.
【mBDSR】 (bonus indicator):
The development concept is the same as 【BODSOR】, but the arrow signal generation conditions and its calculation method are completely
different.
Because more arrow signals are generated than with 【BODSOR】, there is a higher possibility of capturing entry opportunities that could not be captured with 【BODSOR】.
The figure below is the 4-hour chart of the South African rand/yen.
South African rand/yen 4-hour chart
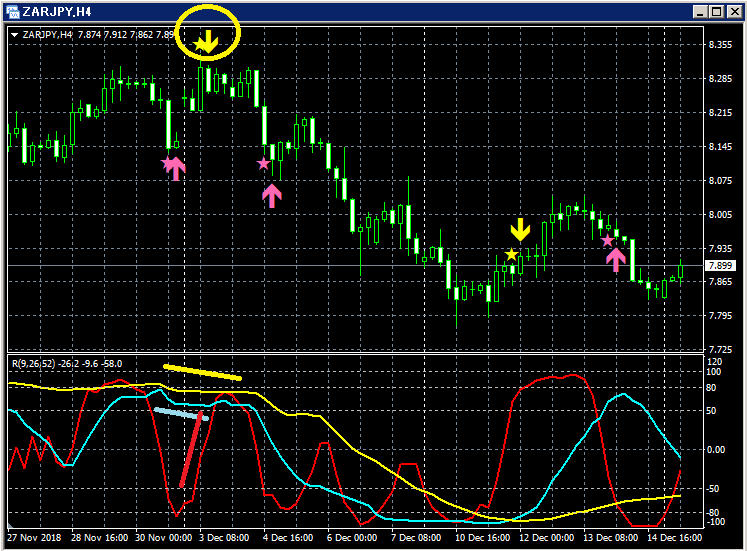
Upper row: mBDSR
Lower row: RCI three-line (red: RCI9, light blue: RCI26, yellow: RCI52)
Among the three RCI lines, only the RCI9 is clearly rising.
If the RCI9 reverses downward, all three RCI lines may descend together.
That is, the price may undergo a strong decline.
In such a situation, mBDSR’s pullback selling signal (yellow arrows circled in a circle) is lighting up.
Immediately after the signal lights, a bearish candlestick forms. It declines without updating the high of that candlestick, which can be observed.
This indicates that the price is falling.
BODSOR (mBDSR) sales page is here.

Twitter
https://twitter.com/RCIX3Line
Blog
http://bodsor.blog.fc2.com/
Investment Navi+
https://fx-on.com/navi/serial/?id=359
YouTube
https://www.youtube.com/channel/UCL-g5uAlesiWVJEDtWlFvGw
Examples of buy-on-dips and pullback-sell signals on USD/JPY 1-hour chart
※Note: In charts within this article, for convenience of explanation, there may be additions of circles, straight lines, or rectangles drawn in yen, etc., so please understand.


