

Nikkei 225 JP225 【Master RCI to Win!!】 New low and breakdown of support, and mBDSR rebound selling signal
【MASTER RCI TO WIN!! Trend Reversal, Buy Dips, Sell on Retracements】
Indicator【BODSOR・mBDSR】that shows its power in combination with RCI
Methods and Case Studies (PDF) ★GogoJungle AWARD2020 Winner★
https://www.gogojungle.co.jp/tools/indicators/11836
The PDF file includes 358 items (over 1,400 pages, over 470,000 characters in total).
At the beginning of this year, the MT5 version Beta was released!!
mBDSR (Product ID 11836) Purchase Bonus】MT5 Version Indicator (Beta)
“mBDSR (no filter, RCI filter, MA filter)”
https://www.gogojungle.co.jp/tools/indicators/56765
To make better use of the MT5 version of mBDSR, we have added 77 more PDFs (over 280 pages, more than 270 chart sheets, over 100,000 characters in total).
Nikkei 225, JP225, 4-hour chart
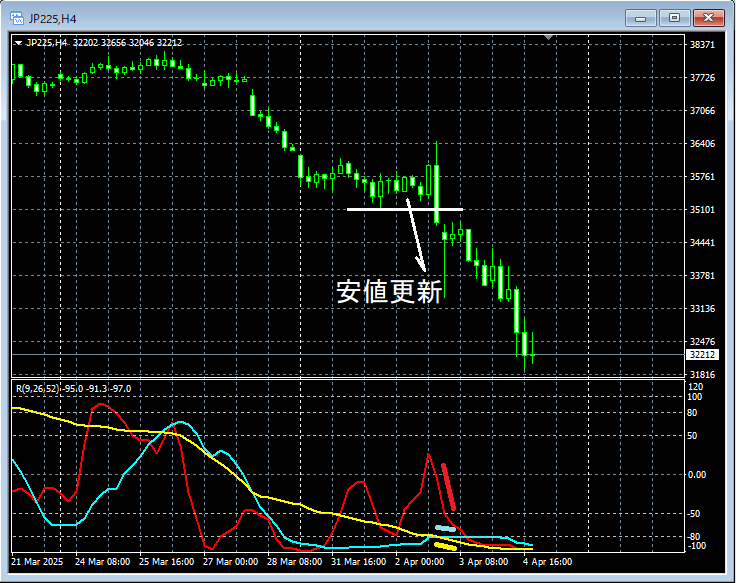
On the 4-hour chart above,new lowafterthe three lines of RCI align to form a very weak downtrend signal.Nikkei 225, JP225, 30-minute chartOn the 30-minute chart above,break of the support lowis followed by a risethe sell-on-rally signal of mBDSR (RCI two-filter)lights up and the price moves further down.From this example,the high compatibility between RCI three-line strategy and Dow Theory trading methodsandthe signals of mBDSRcan be observed.※Note: In the charts introduced in this article, for convenience, circles, straight lines, and squares may be drawn.Indicator【BODSOR・mBDSR】that powers up when combined with RCIMethods and Case Studies (PDF) ★GogoJungle AWARD2020 Winner★https://www.gogojungle.co.jp/tools/indicators/11836The PDF file includes 358 items (over 1,400 pages, over 470,000 characters in total).Many of these are summarized as examples that break down how to logically link higher and lower timeframes using three-line RCI to examine multiple lower-timeframe situations sequentially, ultimately waiting for the dips or rallies in the lower timeframes (i.e., the signals of mBDSR).Additionally,there are many that focus on identifying points where multiple entry reasons overlap..Furthermore,there are also methods that explore upward and downward targets using three-line RCI..In the PDF explanations,over 1,350 chartsare used.
Nikkei 225, JP225, 30-minute chart
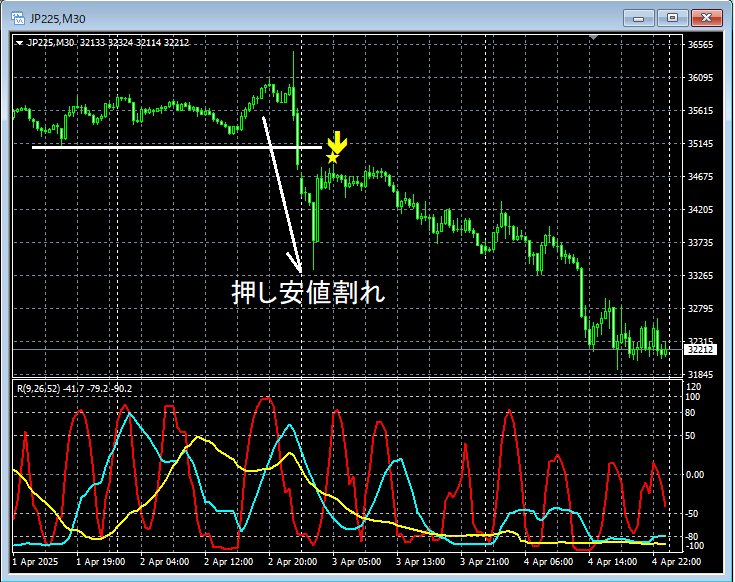
On the 30-minute chart above,break of the support lowis followed by a risethe sell-on-rally signal of mBDSR (RCI two-filter)lights up and the price moves further down.
From this example,the high compatibility between RCI three-line strategy and Dow Theory trading methodsandthe signals of mBDSRcan be observed.
※Note: In the charts introduced in this article, for convenience, circles, straight lines, and squares may be drawn.
Indicator【BODSOR・mBDSR】that powers up when combined with RCI
Methods and Case Studies (PDF) ★GogoJungle AWARD2020 Winner★
https://www.gogojungle.co.jp/tools/indicators/11836
The PDF file includes 358 items (over 1,400 pages, over 470,000 characters in total).
Many of these are summarized as examples that break down how to logically link higher and lower timeframes using three-line RCI to examine multiple lower-timeframe situations sequentially, ultimately waiting for the dips or rallies in the lower timeframes (i.e., the signals of mBDSR).
Additionally,there are many that focus on identifying points where multiple entry reasons overlap..
Furthermore,there are also methods that explore upward and downward targets using three-line RCI..
In the PDF explanations,over 1,350 chartsare used.

× ![]()


