

[Master RCI] Victory to the Extreme!! Break of Support and mBDSR Reversal Sell Signal AUDUSD 5-minute Chart
【Master RCI to Win Intensely!! Trend Reversal, Buy the Dip, Sell the Rally】
Indicator that unleashes power in combination with RCI【BODSOR・mBDSR】
Methods and Case Studies (PDF) ★GogoJungle AWARD2020 Winner★
https://www.gogojungle.co.jp/tools/indicators/11836
The PDF file comes with 358 items (over 1,400 pages, over 470,000 characters in total).
Earlier this year, the MT5 version Beta was released!!
mBDSR (Product ID 11836) Purchase Bonus】MT5 Version Indicator (Beta)
“mBDSR (no filter, RCI filter, MA filter)”
https://www.gogojungle.co.jp/tools/indicators/56765
To make better use of the MT5 version of mBDSR, we have added 77 more PDFs (over 280 pages, over 270 chart sheets, over 100,000 characters in total).
AUDUSD Five-Minute Chart
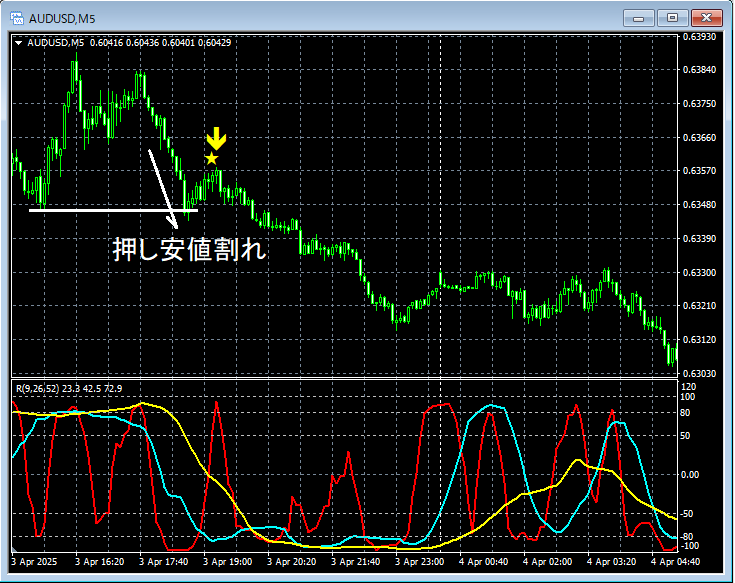
In the above 5-minute chart,Break of the support lowfollowed by an up movemBDSR (2 RCI filters) Sell signallights up and price declines.
Because the break of the support low negates the uptrend for a moment,this indicates there is one more basis for selling compared to a simple sell signal.
From this example,a trading method focused on Dow Theoryandthe signal of mBDSRshow high compatibility.
※Please note that in the charts introduced in this article, for convenience of explanation, circles, straight lines, and rectangles may have been drawn.
The indicator that excels in combination with RCI【BODSOR・mBDSR】
Methods and Case Studies (PDF) ★GogoJungle AWARD2020 Winner★
https://www.gogojungle.co.jp/tools/indicators/11836
The PDF file comes with 358 items (over 1,400 pages, over 470,000 characters in total).
Many of these are about using three RCI lines to logically link higher and lower timeframes, examining multiple lower-timeframe conditions step by step, and ultimately waiting for the timing of a dip buy or a pullback sell on the lower timeframe (i.e., the mBDSR signal).
Additionally,there are many that emphasize capturing points where multiple entry fundamentals coincide.There are also many that explore discovering targets for upward or downward movement using three RCI lines.
Furthermore,the material includes methods that investigate upside and downside targets using three RCI lines.
In the PDF explanations,over 1,350 chartsare used.

× ![]()


