

【Master RCI to Win!!】Break of support at push low and mBDSR return-sell signal NZDUSD 5-minute chart
【Master RCI to Win Absolutely!! Trend Reversal, Buy on Dips, Sell on Rallies】
An indicator that shines in combination with RCI: 【BODSOR・mBDSR】
and methods and case studies (PDF) ★GogoJungle AWARD2020 winner★
https://www.gogojungle.co.jp/tools/indicators/11836
The PDF file includes 358 items (over 1,400 pages in total, over 470,000 characters in total).
At the beginning of this year, the MT5 version beta was released!!
mBDSR (Product ID 11836) Purchase Bonus】MT5 version indicator (beta)
“mBDSR (no filter, RCI filter, MA filter)”
https://www.gogojungle.co.jp/tools/indicators/56765
To help you use the MT5 version of mBDSR more effectively, we have added 77 more PDFs (over 280 pages, over 270 chart sheets, over 100,000 characters in total).
Kiwi Dollar NZDUSD 5-minute chart
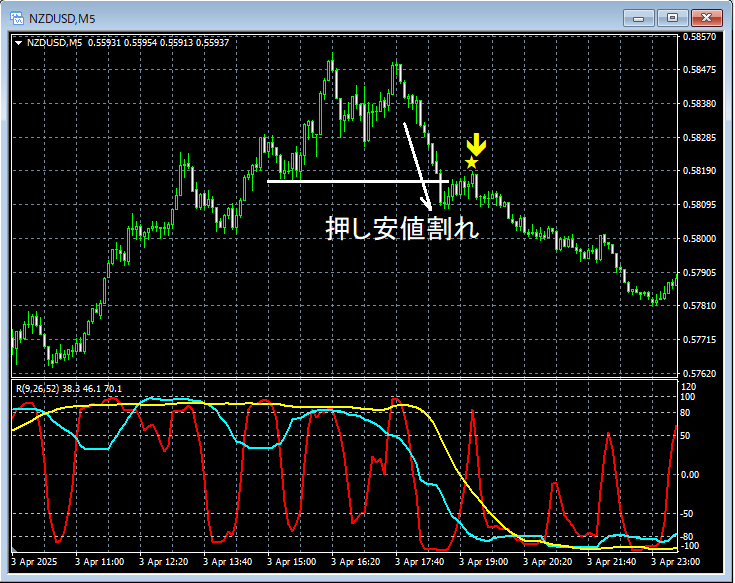
In the 5-minute chart above,after breaking the swing-lowthe price declines as the mBDSR (two RCI filters) sell signal lights up.
Because the swing-low was broken,the uptrend is temporarily denied, so compared to simply having a sell signal, there is one more selling rationale.
From this example,the synergy between a Dow Theory-focused trading methodandthe mBDSR signalsis evident.
※Please note that in the charts introduced in this article, for convenience of explanation, circles, lines, and rectangles may be drawn.
An indicator that shines in combination with RCI【BODSOR・mBDSR】
and methods and case studies (PDF) ★GogoJungle AWARD2020 winner★
https://www.gogojungle.co.jp/tools/indicators/11836
The PDF file includes 358 items (over 1,400 pages in total, over 470,000 characters in total).
Many of them are about linking higher-timeframe and lower-timeframe logically using three RCI lines, and then sequentially considering the situations of multiple lower timeframes, ultimately waiting for the dip-buy or rally-sell timing (i.e., the mBDSR signals) on the lower timeframe
Also,many focus on identifying points where multiple entry reasons overlap.
Additionally,there are methods for exploring upside targets and downside targets using three RCI linesas well.
In the explanations within the PDFs,more than 1,350 chartsare used.

× ![]()


