

Master RCI to the extreme!! Signals for selling on a pullback after breaking the support and the mBDSR return-sell signal Euro-Dollar 5-minute chart
【Mastering RCI!! Trend Reversal, Buy on Dips, Sell on Rallies】
Indicator【BODSOR・mBDSR】that shows strong power when used with RCI
and methodology・case studies (PDF) ★GogoJungle AWARD2020 Winner★
https://www.gogojungle.co.jp/tools/indicators/11836
The PDF file includes 358 items (over 1,400 pages, over 470,000 characters in total).
At the beginning of this year, the MT5 version Beta was released!!
mBDSR (Product ID 11836) Purchase Bonus】MT5 version of the indicator (Beta)
“mBDSR (no filter, RCI filter, MA filter)”
https://www.gogojungle.co.jp/tools/indicators/56765
To help you use the MT5 version of mBDSR more effectively, an additional 77 PDFs (over 280 pages, over 270 chart sheets, over 100,000 characters) have been added.
EURUSD, 5-minute chart
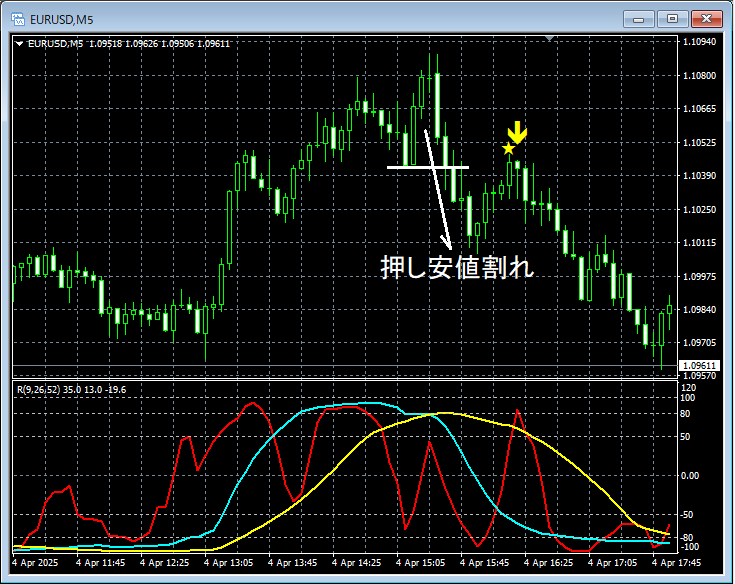
On the 5-minute chart above,break of the swing lowafter the pullback,the sell-rebound signal of mBDSR (two RCI filters) lights up and the price moves down.Because the break of the swing low temporarily negates the uptrend, compared to simply having a sell-rebound signal, there is one more basis for selling.From this example,the high compatibility between Dow Theory-based trading methodsandthe signals of mBDSRis evident.※Please note that the charts introduced in this article may have circles, straight lines, or squares added for explanatory convenience.Indicator【BODSOR・mBDSR】that shows strong power when used with RCIand methodology・case studies (PDF) ★GogoJungle AWARD2020 Winner★https://www.gogojungle.co.jp/tools/indicators/11836The PDF file includes 358 items (over 1,400 pages, over 470,000 characters in total).Many of them are a summary of the approach that links the higher and lower timeframes logically using three RCI lines, examines the situations of multiple lower timeframes sequentially, and ultimately waits for pullbacks or pullback sell timing (=mBDSR signals) on the lower timeframes.Also,there is a strong emphasis on capturing points where multiple entry reasons coincideas well.Additionally,there are methods that explore upward and downward targets using three RCI lines.Also included.In the descriptions within the PDFs,over 1,350 chartsare used.
Because the break of the swing low temporarily negates the uptrend, compared to simply having a sell-rebound signal, there is one more basis for selling.From this example,the high compatibility between Dow Theory-based trading methodsandthe signals of mBDSRis evident.※Please note that the charts introduced in this article may have circles, straight lines, or squares added for explanatory convenience.Indicator【BODSOR・mBDSR】that shows strong power when used with RCIand methodology・case studies (PDF) ★GogoJungle AWARD2020 Winner★https://www.gogojungle.co.jp/tools/indicators/11836The PDF file includes 358 items (over 1,400 pages, over 470,000 characters in total).Many of them are a summary of the approach that links the higher and lower timeframes logically using three RCI lines, examines the situations of multiple lower timeframes sequentially, and ultimately waits for pullbacks or pullback sell timing (=mBDSR signals) on the lower timeframes.Also,there is a strong emphasis on capturing points where multiple entry reasons coincideas well.Additionally,there are methods that explore upward and downward targets using three RCI lines.Also included.In the descriptions within the PDFs,over 1,350 chartsare used.
From this example,the high compatibility between Dow Theory-based trading methodsandthe signals of mBDSRis evident.
※Please note that the charts introduced in this article may have circles, straight lines, or squares added for explanatory convenience.
Indicator【BODSOR・mBDSR】that shows strong power when used with RCI
and methodology・case studies (PDF) ★GogoJungle AWARD2020 Winner★
https://www.gogojungle.co.jp/tools/indicators/11836
The PDF file includes 358 items (over 1,400 pages, over 470,000 characters in total).
Many of them are a summary of the approach that links the higher and lower timeframes logically using three RCI lines, examines the situations of multiple lower timeframes sequentially, and ultimately waits for pullbacks or pullback sell timing (=mBDSR signals) on the lower timeframes.
Also,there is a strong emphasis on capturing points where multiple entry reasons coincideas well.
Additionally,there are methods that explore upward and downward targets using three RCI lines.Also included.
In the descriptions within the PDFs,over 1,350 chartsare used.

× ![]()


