

Immediate drop right after the selling signal lights up [RCI 3-line + mBDSR] EUR/USD 15-minute chart
Campaign is ongoing until January 10, 2019.
The sales page for BODSOR (mBDSR) is here.
BODSOR is an indicator developed to improve entry accuracy when applying buy-the-dottom or sell-on-rebounds using the RCI3-line.
This time, a bonus indicator 【mBDSR】 is attached to 【BODSOR】.
【mBDSR】 (Bonus Indicator):
The development concept is the same as 【BODSOR】, but the arrow signal generation conditions and their calculation method are completely different.
Since more arrow signals occur than with BODSOR, there is a higher possibility of capturing entry opportunities that could not be captured by 【BODSOR】.
The chart below is the EUR/USD 15-minute chart.
EUR/USD 15-minute chart (December 14, 2018)
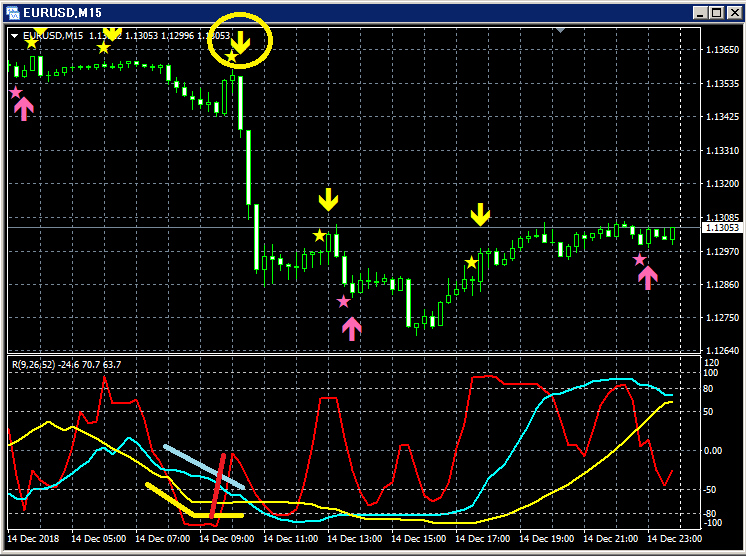
Upper level: mBDSR
Of the three RCI lines, only RCI9 is clearly rising.
If RCI9 reverses downward, all three RCI lines may decline, indicating a potential strong price drop.
In other words, there is a high possibility of a strong price decline.
In such a scenario, the signal to sell on a rally is shown by mBDSR’s signal (yellow arrows encircled).
Immediately after the signal lights up, three large bearish candles occurred in succession, causing a sharp drop.
Also, the candle that lit the signal is a bearish candle without an upper wick, showing no price retracement at all.
This confirms the absence of price retracement.
The sales page for BODSOR (mBDSR) is here.

Twitter
https://twitter.com/RCIX3Line
Blog
http://bodsor.blog.fc2.com/
Investment Navi+
https://fx-on.com/navi/serial/?id=359
YouTube
https://www.youtube.com/channel/UCL-g5uAlesiWVJEDtWlFvGw
Examples of buy-the-dips and sell-on-rises signals on the USD/JPY 1-hour chart
※ In the charts in this article, for convenience of explanation, yen marks, straight lines, and squares may be drawn, so please note.


