

GBPUSD 5-minute chart Pullback Buy Signal [RCI 3-line + mBDSR]
※Campaign is ongoing until January 10, 2019.
BODSOR (mBDSR)sales page ishere.
※ BODSOR is an indicator developed to improve the entry accuracy when making pullback buys or pullback sells using the RCi3 main lines.
This time, an extra indicator [mBDSR] has been included with 【BODSOR】.
【mBDSR】 (the extra indicator):
The development concept is the same as 【BODSOR】, but the arrow signal generation conditions and its calculation method are completely
different.
Since more arrow signals are generated than with 【BODSOR】, it is more likely to capture entry opportunities that could not be captured with 【BODSOR】.
The figure below is the 5-minute chart of GBP/USD.
GBP/USD 5-minute chart (December 14, 2018)
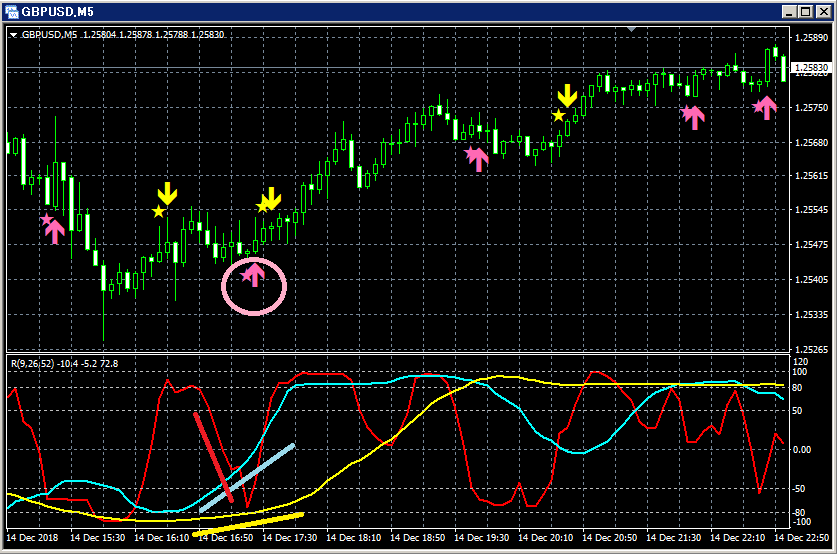
Bottom: RCI three-line (Red: RCI9, Light blue: RCI26, Yellow: RCI52)
If RCI9 reverses and moves up, there is a possibility that all three RCI lines rise.
In other words, the price may rise strongly.
In such a situation, the sign of buying on dips for mBDSR lights up (pink arrows circled in a circle).
Immediately after the signal lights up, four bullish candles appear in succession, and the price continues to rise afterward
as can be seen.
BODSOR (mBDSR) sales page ishere.

Twitter
https://twitter.com/RCIX3Line
Blog
http://bodsor.blog.fc2.com/
Investment Navi+
https://fx-on.com/navi/serial/?id=359
YouTube
https://www.youtube.com/channel/UCL-g5uAlesiWVJEDtWlFvGw
Example of pullback buying and pullback selling signals on USD/JPY 1-hour chart
※In the charts within this article, for convenience of explanation, circles, straight lines, squares, etc. may be drawn, so please understand.


